Grafika przedstawiająca tablicę szkolną. Write your daily per-capita water consumption estimates on the board. Then, specify the range of average daily water consumption and compare the resulting values with the date in the graph showing water consumption in selected countries in the “Water and humans” lesson (tu wpisz).
Grafika przedstawiająca tablicę szkolną. Write your daily per-capita water consumption estimates on the board. Then, specify the range of average daily water consumption and compare the resulting values with the date in the graph showing water consumption in selected countries in the “Water and humans” lesson (tu wpisz).
Write your daily per-capita water consumption estimates on the board. Then, specify the range of average daily water consumption and compare the resulting values with the date in the graph showing water consumption in selected countries in the “Water and humans” lesson.
Due to the growing human population in the world, the demand for water for hygiene, agriculture and preparing food is increasing. Water is also needed for industrial production and services. This is the need for it is constantly growing.
RJfzTwDTxdOZS
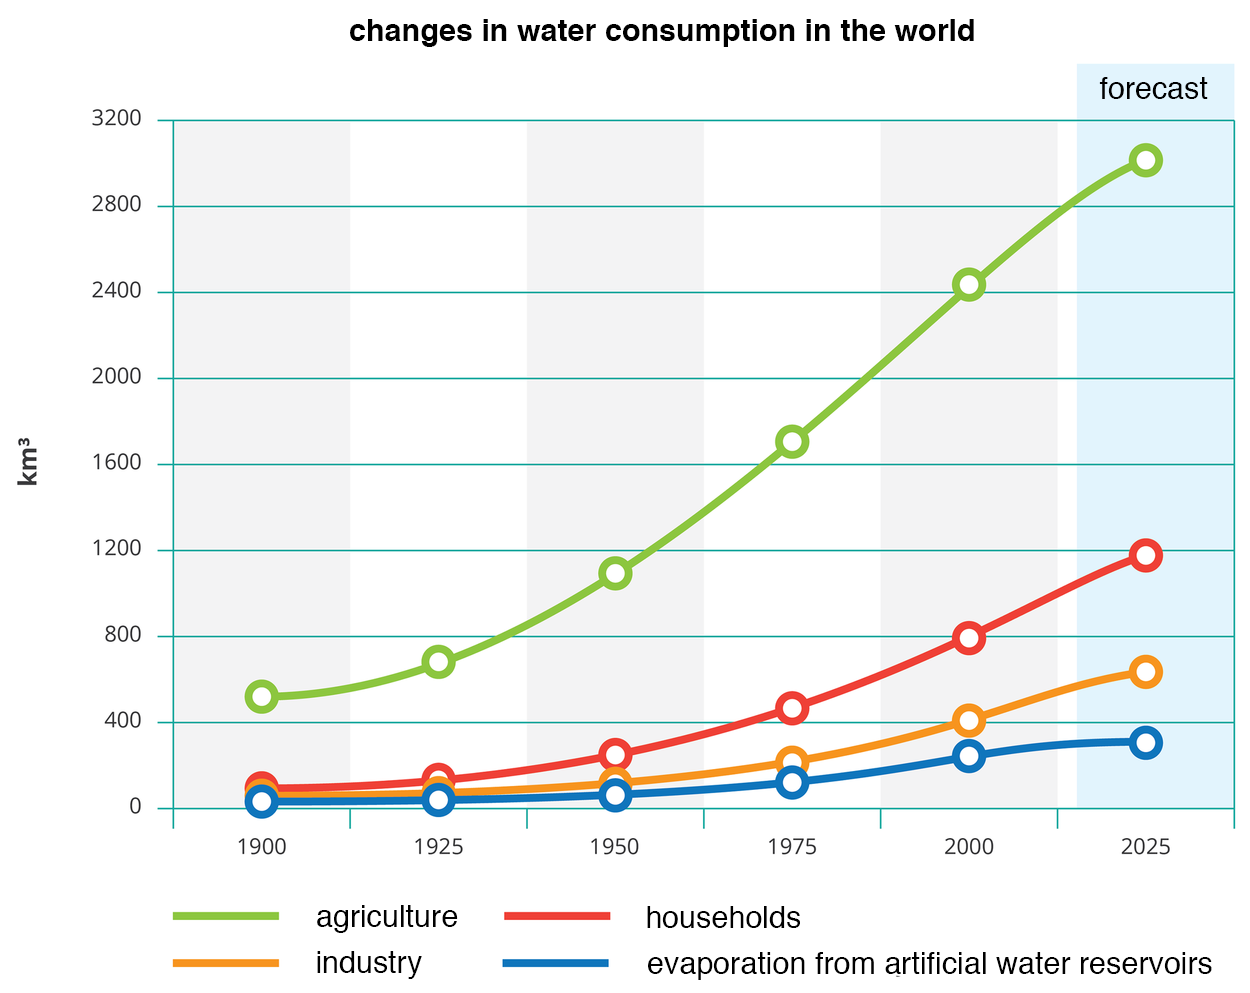
Na ilustracji wykres liniowy, wzrost zużycia wody na świecie, changes in water consumption in the world. Cztery linie oznaczają – rolnictwo, agriculture, przemysł, industry, gospodarstwa domowe, households, parowanie sztucznych zbiorników wodnych, evaporation from artificial water reservoirs. Wszystkie wartości rosną od tysiąc dziewięćset dziewięćdziesiątego roku do dwa tysiące dwudziestego piątego roku (prognoza - forecast). Rolnictwo zużywa najwięcej wody i ma największy wzrost wartości w tym przedziale czasowym. W 1900 500 kilometrów sześciennych wody a w 2025 przewiduje się, że zużyje 3000 kilometrów sześciennych wody. Najmniejsze zużycie wody odbywa się przez parowanie i przejawia najmniejszy wzrost. W 1900 niewiele ponad 50 kilometrów sześciennych wody a w 2025 przewiduje się, że zużyje 350 kilometrów sześciennych wody. Przemysł - W 1900 niewiele ponad 50 kilometrów sześciennych wody a w 2025 przewiduje się, że zużyje 600 kilometrów sześciennych wody. Gospodarstwa domowe - W 1900 niewiele ponad 60 kilometrów sześciennych wody a w 2025 przewiduje się, że zużyje 1200 kilometrów sześciennych wody.
Changes in global water consumption
Source: Dariusz Adryan, licencja: CC BY 3.0.
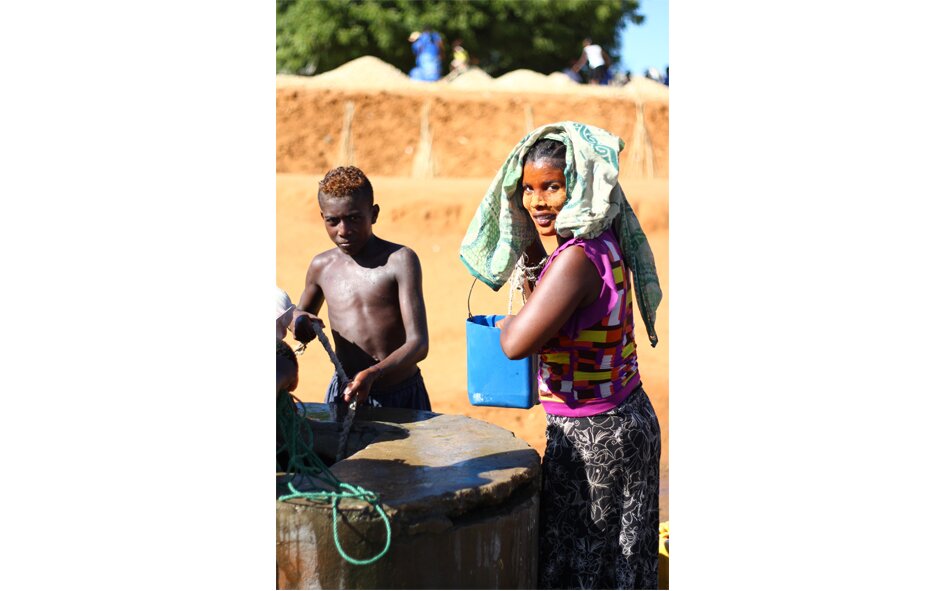
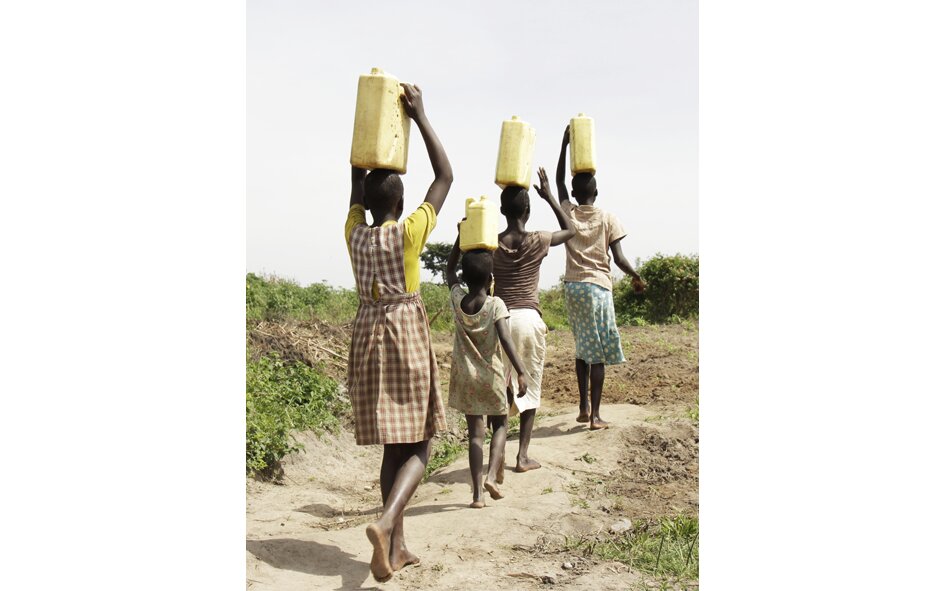
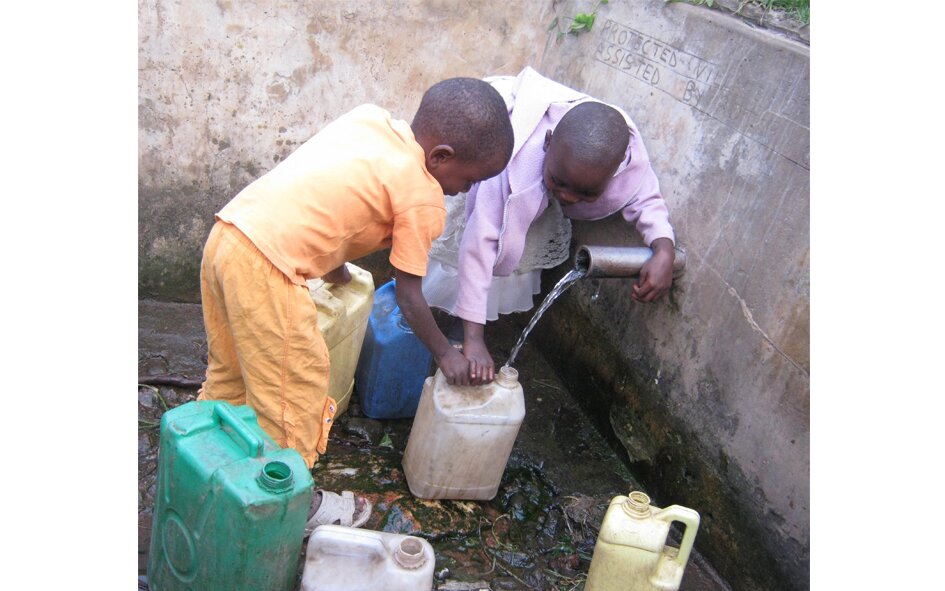
Gallery 1. Water shortage in developing countries
In areas affected by water shortage, people use untreated water, which may lead to infections with pathogenic organisms. Diseases that spread by infected water include diarrhoea, skin, kidney and liver diseases, and typhoid
Rj9auyhBFvFCq
Zdjęcie przedstawia mieszkańców Madagaskaru, którzy czerpią wodę z jednej ze studni zbudowanych z fundacji charytatywnej.
Residents of Madagascar drawing water from one of the wells built from the charity fundraiser.
Source: licencja: CC 0, [online], dostępny w internecie: www.pixabay.com.
R1bDPGTbXOog1
Zdjęcie przedstawia czarnoskóre dziewczynki, które niosą na głowach kanistry pełne wody. Uganda, Afryka.
The girls are back home, carrying canisters full of water on their heads. Uganda, Africa.
Source: licencja: CC 0, [online], dostępny w internecie: www.pixabay.com.
RGu8NHKHAKqUh
Zdjęcie przedstawia czarnoskóre dzieci wlewające wodę do kanistrów.
Children pour water into canisters.
Source: licencja: CC 0, [online], dostępny w internecie: www.pixabay.com.
R1Raw77sB0OQS
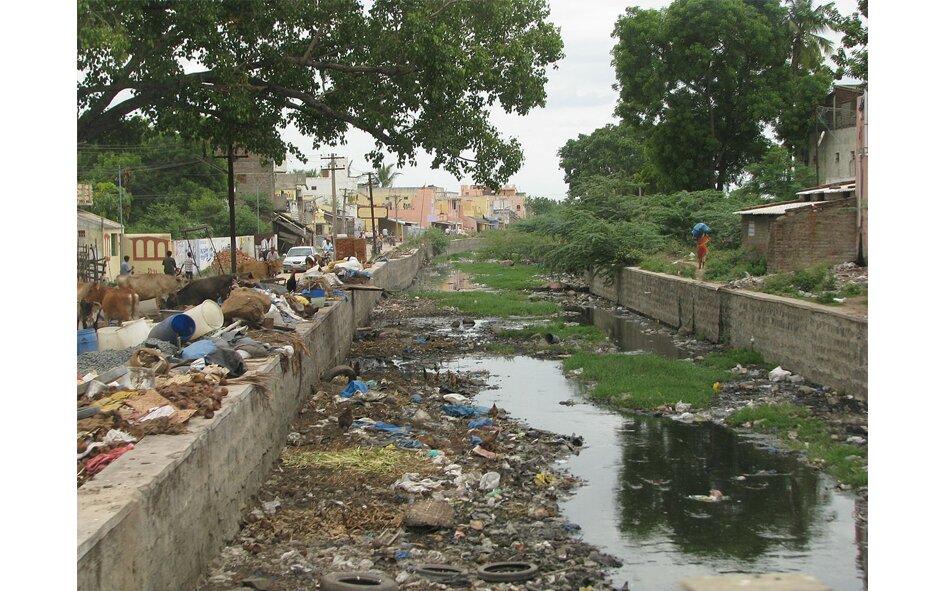
Zdjęcie przedstawia zanieczyszczenie wody w Indiach. Na zdjęciu kanał wodny biegnący wzdłuż osiedla, w którym pełno jest śmieci, opon samochodowych, foliówek, plastikowych rur, i tak dalej.
Water pollution in India.
Source: Tamil Nadu, licencja: CC BY 2.0, [online], dostępny w internecie: https://en.wikipedia.org/wiki/Water_pollution_in_India#/media/File:India_-_Sights_&_Culture_-_garbage-filled_canal_(2832914746).jpg.
Rg48gYmsg784n
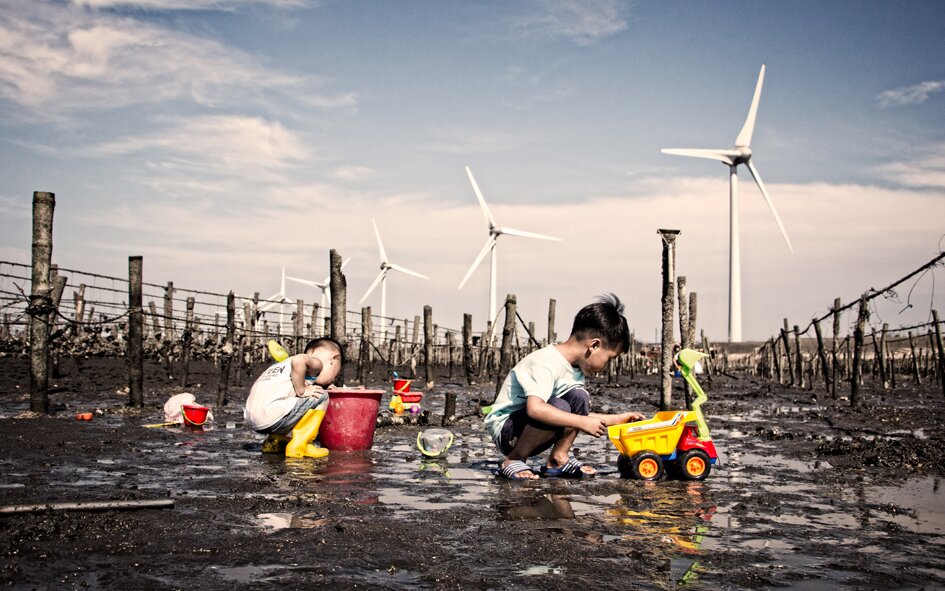
Zdjęcie przedstawia degradację środowiska naturalnego w Chinach, która znacznie ograniczyła dostęp do wody pitnej. Dzieci bawią się w błocie na opustoszałym polu. W pobliżu wiatraki, kumulujące energię z wiatru.
The degradation of the natural environment in China significantly reduced access to drinking water.
Source: licencja: CC 0, [online], dostępny w internecie: www.pixabay.com.
RFFznJW1IN2MO
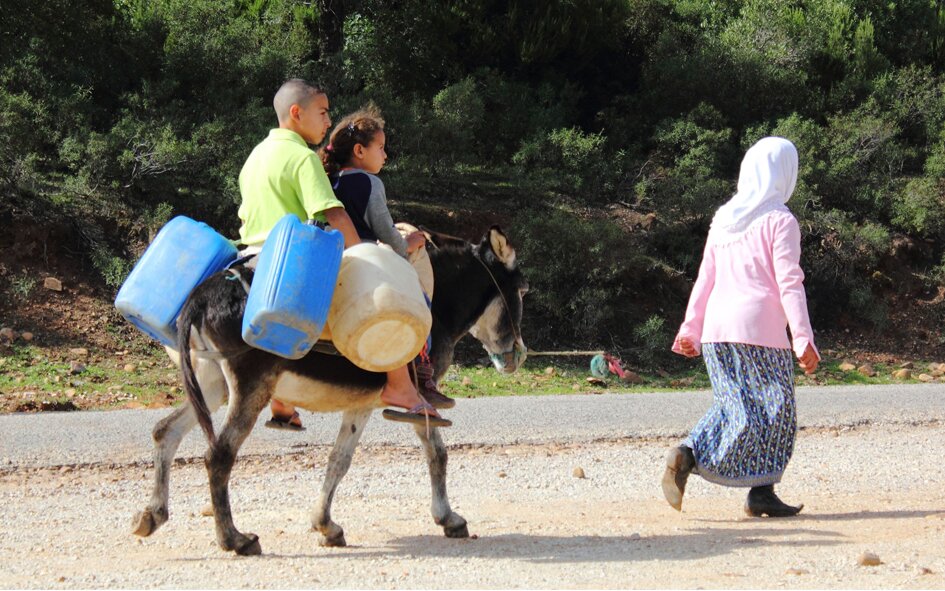
Zdjęcie przedstawia rodzinę podążającą z pustymi kanistrami i beczkami po wodę. Siedzą na ośle, który idzie piaszczystą drogą.
In rural Tunisia, access to drinking water is still limited.
Source: licencja: CC 0, [online], dostępny w internecie: www.pixabay.com.
These demands are not always satisfied. According to estimates, 1.2 billion people (almost 20% of total world population) lack water due to natural causes. Another 0.5 billion is on the verge of such a situation. Approximately 1.6 billion do not have access to sufficient water as they lack the resources to obtain it.
Water may be chemically contaminated by fertiliser or pesticides leached from farming fields. Another sources of contamination include household sewage, especially in rapidly growing cities of developing countries, and industrial plants and means of water transport.
RKzEYySYBBDcz
Exercise 1
What are the factors behind the growing global demand for water? Select all correct answers. Możliwe odpowiedzi: 1. Microorganism contamination in water, 2. Growing global human population, 3. Using water for recreational purposes, 4. Industry and agriculture development, 5. Droughts
What are the factors behind the growing global demand for water? Select all correct answers. Możliwe odpowiedzi: 1. Microorganism contamination in water, 2. Growing global human population, 3. Using water for recreational purposes, 4. Industry and agriculture development, 5. Droughts
What are the factors behind the growing global demand for water? Select all correct answers.
Microorganism contamination in water
Growing global human population
Using water for recreational purposes
Industry and agriculture development
Droughts
Rr2OYjGcCJECv
Exercise 2
Categorise the items appropriately.
River contamination sources
Causes of lowering water levels in rivers
Możliwe odpowiedzi: 1. badly designed dams and reservoirs, 2. excessive water consumption, 3. fertilisers or pesticides, 4. industry and transport, 5. pathogenic organisms, 6. increased evaporation from artificial reservoirs, 7. household sewage
Categorise the items appropriately.
excessive water consumption, industry and transport, pathogenic organisms, increased evaporation from artificial reservoirs, fertilisers or pesticides, badly designed dams and reservoirs, household sewage
River contamination sources:
Causes of lowering water levels in rivers:
R1POFS3fj2rMx
Exercise 3
Fill in the gaps. Lack of water for drinking and hygiene is a {uzupełnij} in developing countries.
Water obtained from lakes, rivers and even small ponds is usually {uzupełnij} with various microorganisms.
A person who drinks such water without treating it first is {uzupełnij}.
Around 80% of diseases in developing countries is {uzupełnij} contaminated water.
Mozliwe odpowiedzi: 1. potable despite being contaminated, 2. huge problem, 3. trivial problem, 4. a result of using, 5. heavily contaminated, 6. unrelated to using, 7. at risk of contracting a disease, 8. safe
Fill in the gaps.
trivial problem, heavily contaminated, at risk of contracting a disease, unrelated to using, safe, huge problem, potable despite being contaminated, a result of using
Lack of water for drinking and hygiene is a .................................................................... in developing countries.
Water obtained from lakes, rivers and even small ponds is usually .................................................................... with various microorganisms.
A person who drinks such water without treating it first is .....................................................................
Around 80% of diseases in developing countries is .................................................................... contaminated water.