Altitude on the map
that you should take a plan or map with you when you go on a trip or a field excursion;
that the plan and the map are scaled‑down representations of areas seen from above;
how to measure distances with a measuring tape.
to use contour lines for reading altitudes;
to distinguish relative altitude from absolute altitude;
to distinguish a hill from a mountain.
What are contour lines used for?
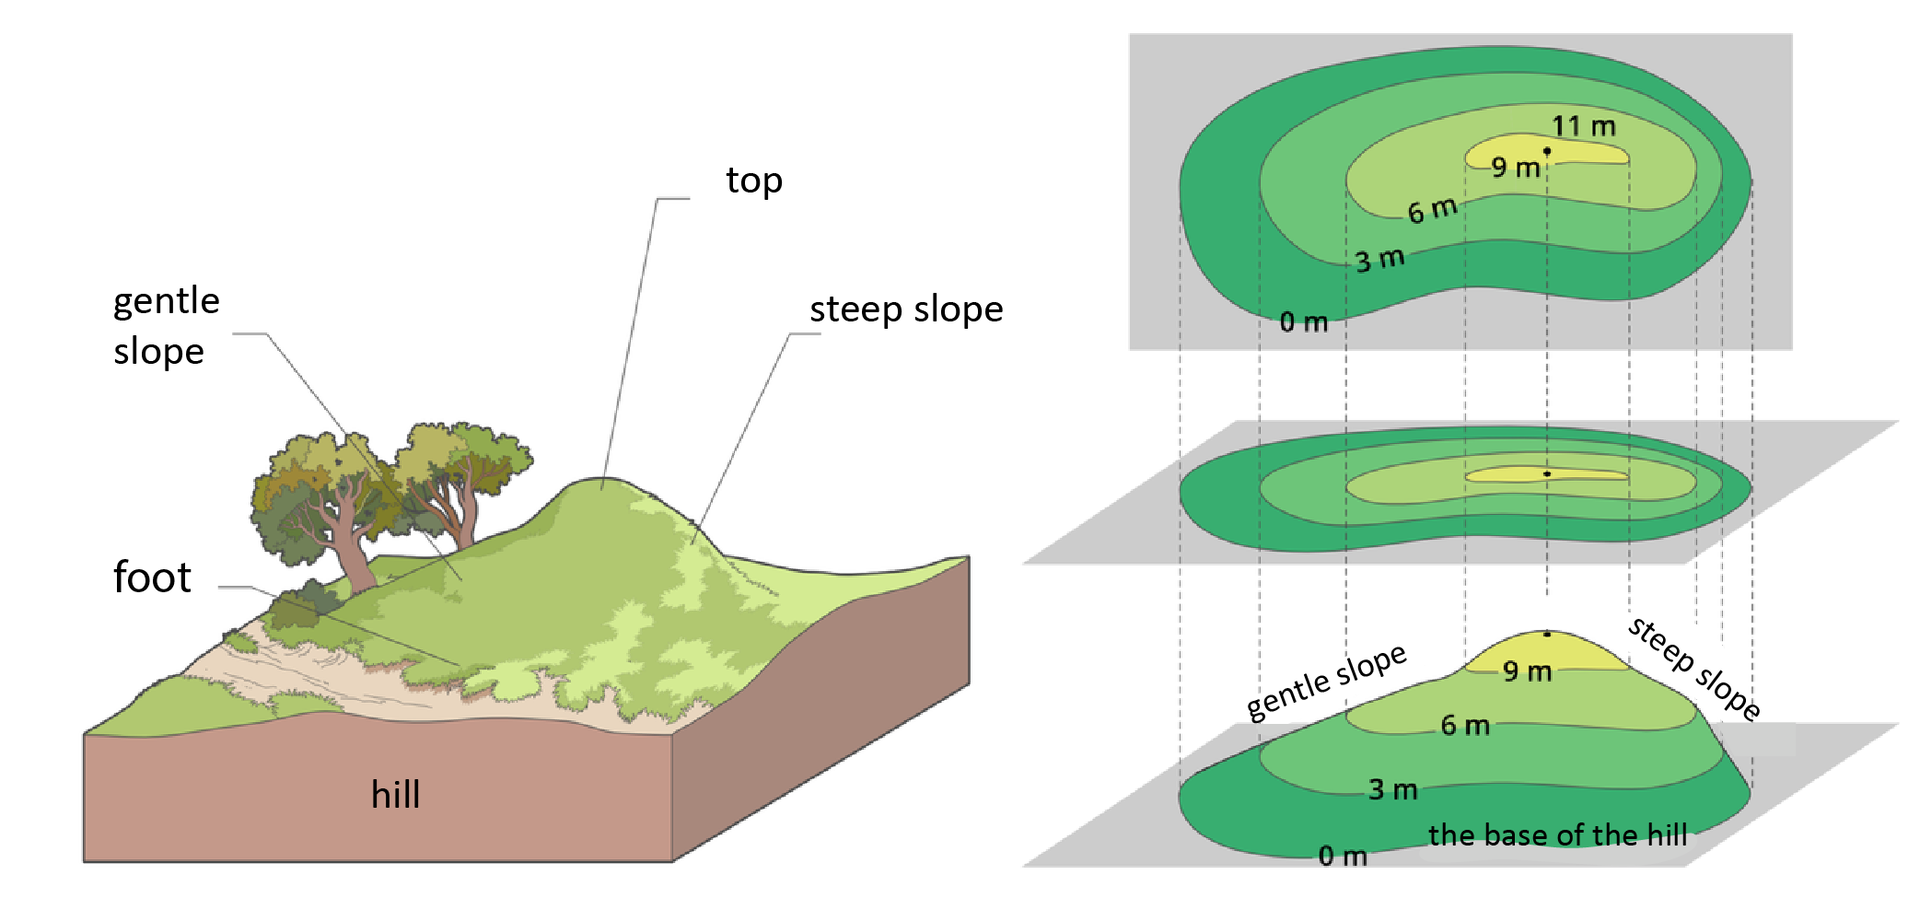
A map and a plan show a diminished area seen from above. However, the depicted area may contain not only forests, houses or roads, but also hills and valleys. How should they be marked on a map? It can be done with contour linescontour lines – lines that join points of equal elevation above sea level. The value of the altitude above sea level is specified next to or on the contour lines. Using a model of a hill, we will try to find out how contour lines are constructed and how they can be used to produce a hypsometric maphypsometric map.

Before you do the „Contour lines” experiment, write down the research question and the hypothesis. Then follow the attached instructions. Make observations during the task, and finally - conclusions.
Relative and absolute altitude
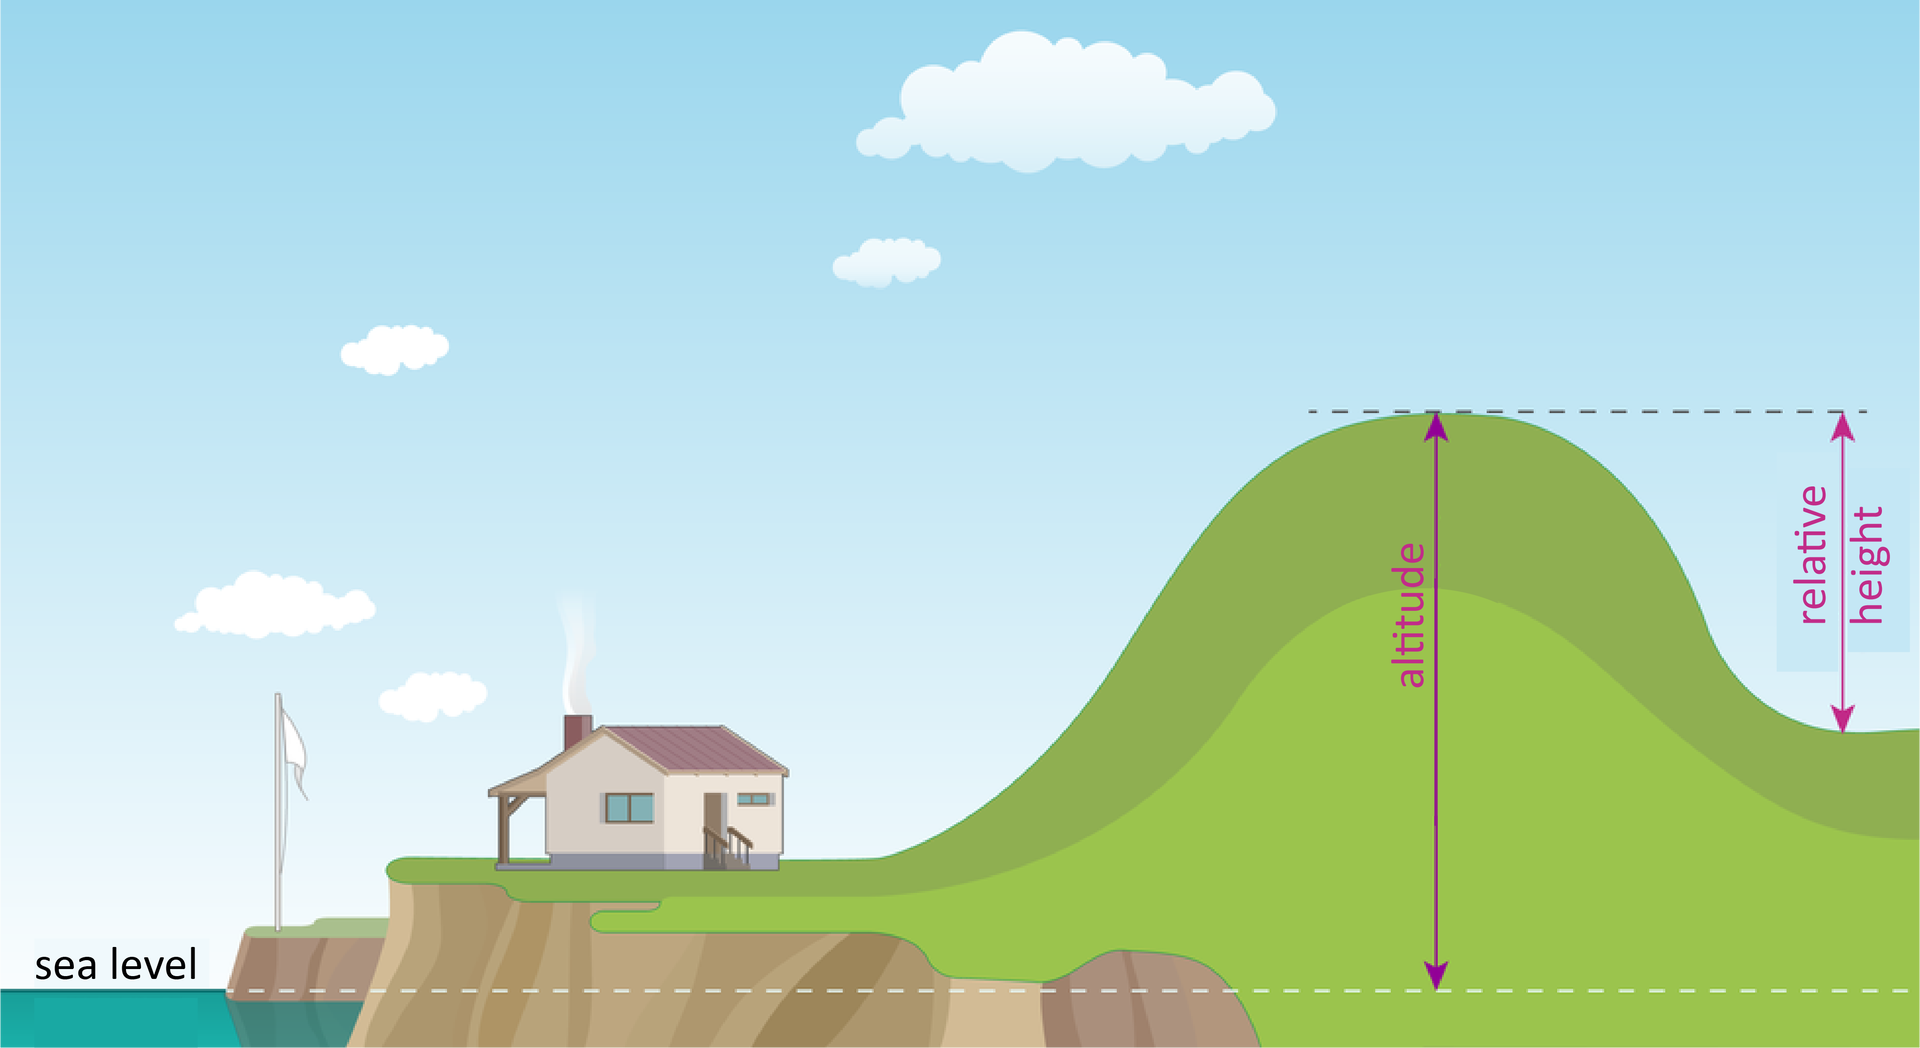
If a peak is marked on the map, there is usually a number expressing its absolute altitudeabsolute altitude. It shows the actual elevation of a given place above sea level. Sometimes a unit of measurement (that is meters) and the abbreviation “a.s.l.” additionally appear next to it. The whole annotation may look like this, for example: „1015 m.a.s.l.”, which should be read as: “one thousand and fifteen meters above sea level”.
If, on the other hand, we measure the height of an elevation from its foot to the top, then we will know its relative altituderelative altitude. Its value depends on where we start the measurement. Relative altitudes are expressed in meters, without an additional abbreviation.
The numbers next to contour lines always relate to absolute altitudes.
Convex and concave forms of terrain
Measuring relative altitudes, we talked about a hill. Perhaps it would be more appropriate to call it a “mountain”? There are many different forms of terrain in our surroundings. If you look around you will see more of them. Some of these forms are convex, that is they are higher than the surrounding area. There are also concave forms, which are lower than their surroundings. In contrast, areas with no significant differences in altitudes are classified as flat forms.
Convex terrain forms include, among other things:
hillock – an elevation with a relative altitude usually not exceeding 50 m;
hill – a convex terrain form with a relative altitude of between 50 m and 300 m;
mountain – a terrain form with a relative altitude of over 300 m.
Concave terrain forms include, for example:
valley – an elongated depression of terrain, usually with gentle slopes, typically with a river flowing through it;
basin – a flat depression in the surface of the land, surrounded by elevations on all sides;
ravine – a deep narrow depression with steep sides.
Lines joining points of equal elevation above sea level on the map are called
- contour lines.
- curves.
- circles.
- stripes.
Summary
Altitudes on maps are marked with contour lines – lines that join points of equal elevation above sea level.
Contour line show the absolute altitude, that is the altitude measured from the sea level.
The relative altitude is measured in relation to a reference point other than the sea level.
We distinguish flat, convex and concave forms of terrain.
Keywords
contour line, relative altitude, absolute altitude
Glossary
mapa hipsometryczna – mapa, na której za pomocą określonych barw przedstawiono wysokość terenu nad poziomem morza
poziomice – linie na mapie łączące punkty o tej samej wysokości bezwzględnej
wysokość względna – wysokość mierzona z dowolnego miejsca, np. od podnóża wzniesienia do jego wierzchołka
wysokość bezwzględna – wysokość mierzona od poziomu morza; wynik odczytuje się bezpośrednio z mapy (bez obliczeń) i podaje się go w metrach nad poziomem morza (w skrócie: m n.p.m.)