to specify the performanceperformanceperformance of the system componentscomponentscomponents,
to monitor the operation of the computer components,
to detect the instability of the computer at long‑term operation and high load,
to detect the cause of a defect.
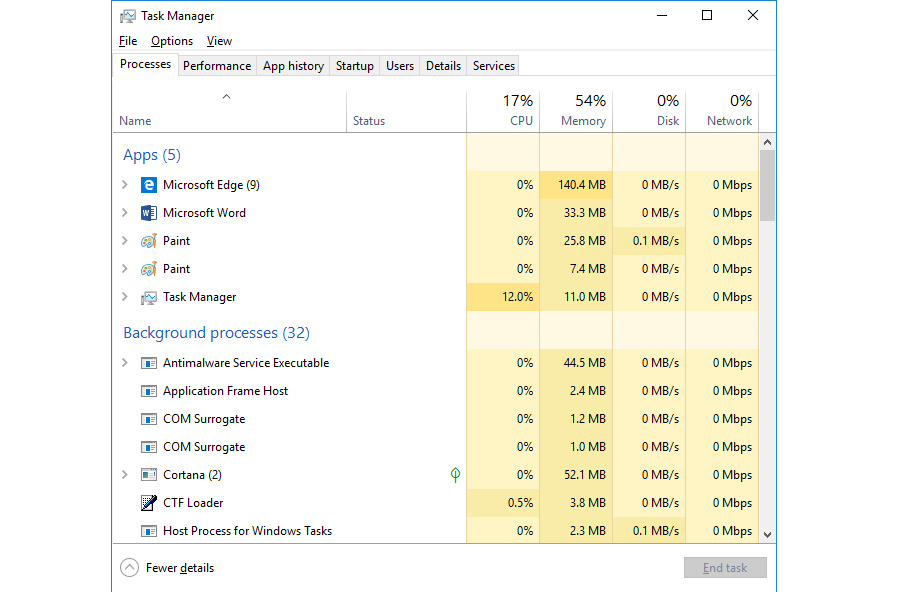
Operating systems offer built‑in functions that can help diagnose the status of the computer. The selected tools of Windows that facilitate the diagnosticsdiagnosticsdiagnostics of the system are discussed below. Task Manager displays the list of running processesprocessesprocesses and servicesservicesservices and informs about the used resources of the particular componentscomponentscomponents of the computer. It also enables to start and stop applications and services.
By using the Help menu of the system or on the Internet find the information how to run the task manager in your system. Start it and test its functions.
R17GVDtEB6WK7
Ilustracja interaktywna przedstawia formatkę Task Manager z aktywną kartą Performance. Po lewej stronie miniatury czterech wykresów. Każda z miniatur prowadzi do monitorowania innych funkcji komputera. Pierwsza – niebieski wykres, obok napis 5% 3.29 GHz. Druga – fioletowy wykres, obok napis 1.3/2.3 GB (57%). Trzecia - fioletowy wykres, obok napis 1%. Czwarta - pomarańczowy wykres, obok napis S:0 R: 0 Kbps. Na ilustracji widoczne są numery, a na nich podpisy. 1. CPU – the current use of the processor (in percentage). {audio}, 2. Memory - the current use of the physical memory (in megabytes). {audio}, 3. Disc - the current use of the disc (in percentage). {audio}, 4. Ethernet – the transfer speed (in kilobits per second). {audio}
Ilustracja interaktywna przedstawia formatkę Task Manager z aktywną kartą Performance. Po lewej stronie miniatury czterech wykresów. Każda z miniatur prowadzi do monitorowania innych funkcji komputera. Pierwsza – niebieski wykres, obok napis 5% 3.29 GHz. Druga – fioletowy wykres, obok napis 1.3/2.3 GB (57%). Trzecia - fioletowy wykres, obok napis 1%. Czwarta - pomarańczowy wykres, obok napis S:0 R: 0 Kbps. Na ilustracji widoczne są numery, a na nich podpisy. 1. CPU – the current use of the processor (in percentage). {audio}, 2. Memory - the current use of the physical memory (in megabytes). {audio}, 3. Disc - the current use of the disc (in percentage). {audio}, 4. Ethernet – the transfer speed (in kilobits per second). {audio}
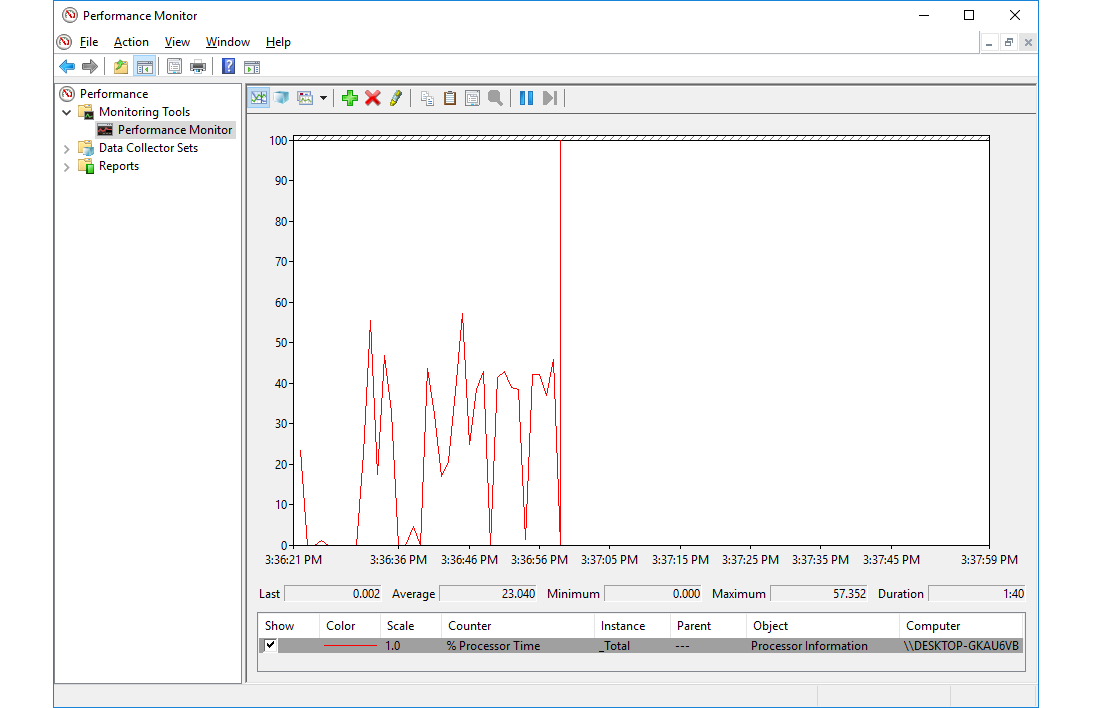
PerformanceperformancePerformance Monitor enables to check the activity of the particular componentscomponentscomponents of the computer and detect which of them slow the computer down. It also allows to assess the impact of particular processesprocessesprocesses on the operation of the computer and to check their interconnections.
R10E1IMEkG0PU
Zrzut ekranu przedstawia okno Monitora Wydajności Performance Monitor. Widoczny jest wykres, dzięki któremu możemy oszacować, jak zmienia się obciążenie systemu (na osi y w skali od 0 do 100) wykonywanymi zadaniami w czasie (na osi x godziny przedstawione są z dokładnością co do sekundy).
By using the Help menu of the system or on the Internet find the information how to run the performance monitor in your system. Start it and test its functions.
Event Viewer is a list of reports, information and errors generated by the operating system and the software installed on the computer. It is used to detect the causes of errors and to analyse the unusual behaviour of the system and applications.
R1DvHdxe6AEtq
Zrzut ekranu przedstawia aplikację menadżera zadań - Task Manager z aktywną kartą Processes pokazującą procesy aktualnie działających aplikacji - sekcja Apps oraz procesy w tle sekcja Background processes. Działające aplikacje przedstawione na zrzucie to: przeglądarka internetowa Edge, edytora tekstów Microsoft Word, dwa okna aplikacji Paint i sam task Managera. Procesy działające w tle to procesy systemowe Windows. Dla każdej aplikacji i procesu wyświetlane jest: zużycie procesora - CPU (w przykładzie 17%), pamięci - Memory (w przykładzie 54%), dysku - DISK (w przykładzie 0%) i pasma sieciowego - Network (w przykładzie 0%).
By using the Help menu of the system or on the Internet find the information how to run the event viewer in your system. Start it and test its functions.
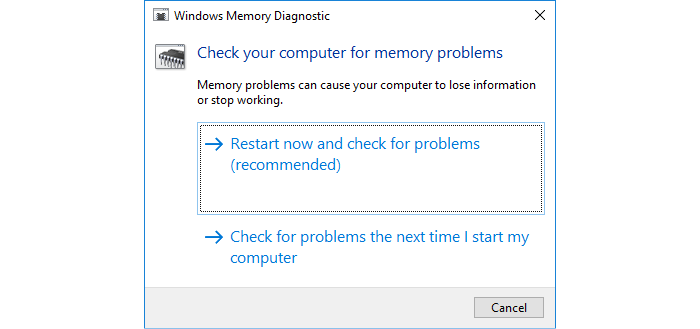
Windows MemorymemoryMemory Diagnostic is a function that diagnoses the RAM memory and enables to detect defective RAM modules.
Rre4RDaZxYMWo
Zrzut ekranu przedstawia okno dialogowe aplikacji Diagnostyka Pamięci Systemu Windows - Windows memory Diagnostic. na górze napis: Check your computer for problems. Niżej: Memory problems can cause your computer to lose information or stop working. Ponieważ wymagane jest zamknięcie wszystkich programów i restartu systemu, użytkownik musi wybrać kiedy ta diagnostyka ma nastąpić. Do wyboru są dwie opcje restartuj teraz lub wykonaj diagnostykę przy ponownym uruchomieniu systemu: Restart now and check for problems (recommended) lub Check for problems the next time I start my computer. Na dole przycisk Cancel.
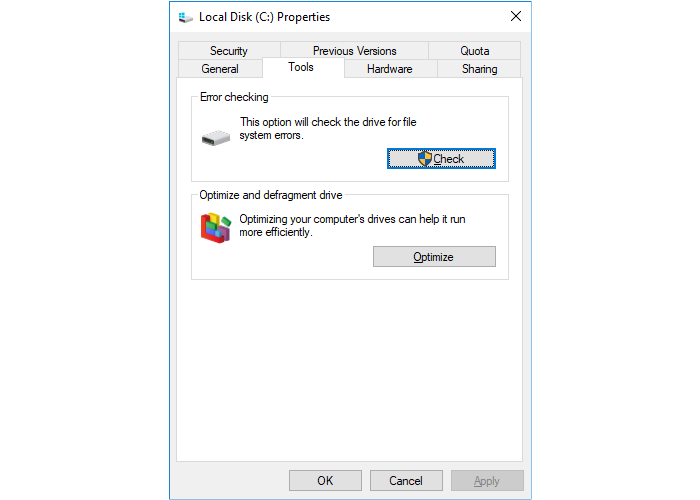
The tools for discdiscdisc checking scan a disc in search of errors. They enable to repair them automatically, if it is possible. They can also identify bad sectors, i.e. defective sectors on the disc. CHKDSK is run after restarting the computer and before the startup of the graphical environment. Disc errors usually occur after the crash of the computer.
RjLAKYVaUteCR
Zrzut ekranu przedstawia okno właściwości dysku lokalnego Local Disk (C:) Properties. z wybraną kartą narzędzia - Tools. Na karcie dostępne są dwie opcje umożliwiające. Pierwsza to sprawdzenie i usunięcie błędów na dysku - sekcja Error checking z przyciskiem Check, znajduje się tu również informacja The option will check the drive for file system errors. Druga to optymalizacja i defragmentacja dysku - sekcja Optimize and defragment drive z przyciskiem Optimize, znajduje się tu również informacja Optimizing your computer's drives can help it run more efficiently. Na dole formatki trzy przyciski OK, Cancel oraz Apply.
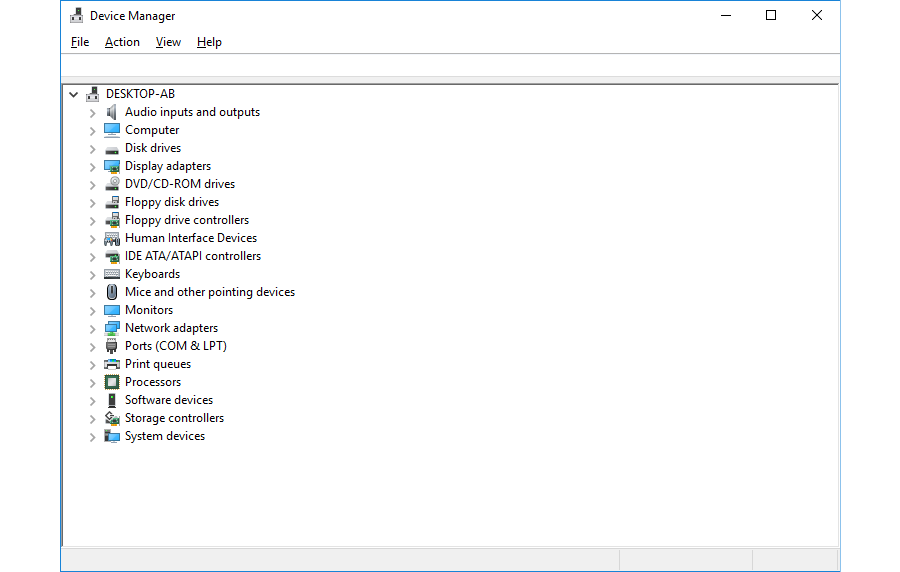
Device Manager displays information about the status of every device connected to the computer. It informs if the device drivers have been correctly installed. Yellow or red icons indicate problems with their functioning.
RoLxXiugjud5o
Zrzut ekranu przedstawia okno aplikacji Menadżer Urządzeń - Device Manager. Aplikacja pokazuje wszystkie składniki komputera oraz pozwala nimi zarządzać. Na górze menu: File, Action, View oraz Help. Poniżej okno zawierające odnośniki do wszystkich urządzeń komputera przedstawionych w postaci listy, jeden pod drugim.
By using the Help menu of the system or on the Internet find the information how to run the device manager in your system. Start it and test its functions.
The temperature of the processorprocessorprocessor is a crucial factor determining the correct functioning of the computer. If it is too high, it results in the unstable operation of the computer. You can check the temperature of the processor in the BIOS of the computer or by using a special programme.
On the Internet find a programme for monitoringmonitoringmonitoring the temperature of the processorprocessorprocessor.
Exercises
Exercise 1
RMT6LjeYz4VsV
Wersja alternatywna ćwiczenia: Task Manager: Możliwe odpowiedzi: 1. displays the list of running processes and services, 2. informs about the used resources of the particular components of the computer, 3. enables to start and stop applications and services, 4. displays the use of the system disc space of the computer
Wersja alternatywna ćwiczenia: Task Manager: Możliwe odpowiedzi: 1. displays the list of running processes and services, 2. informs about the used resources of the particular components of the computer, 3. enables to start and stop applications and services, 4. displays the use of the system disc space of the computer
Task Manager:
displays the list of running processes and services
informs about the used resources of the particular components of the computer
enables to start and stop applications and services
displays the use of the system disc space of the computer
zadanie
Source: GroMar, licencja: CC BY 3.0.
Exercise 2
Find the information and create a multimedia presentation about the diagnostic tools in Linux.
Exercise 3
Tell in English what diagnostic tools or software you use to monitor the operation of your computer.
Exercise 4
RyCgXJYQTTmFT
Wersja alternatywna ćwiczenia: Indicate which pairs of expressions or words are translated correctly. Możliwe odpowiedzi: 1. diagnostyka - diagnostics, 2. wydajność - performance, 3. monitorowanie - monitoring, 4. podzespoły - components, 5. procesy - processor, 6. usługi - processes
Wersja alternatywna ćwiczenia: Indicate which pairs of expressions or words are translated correctly. Możliwe odpowiedzi: 1. diagnostyka - diagnostics, 2. wydajność - performance, 3. monitorowanie - monitoring, 4. podzespoły - components, 5. procesy - processor, 6. usługi - processes
Indicate which pairs of expressions or words are translated correctly.
diagnostyka - diagnostics
wydajność - performance
monitorowanie - monitoring
podzespoły - components
procesy - processor
usługi - processes
zadanie
Source: GroMar, licencja: CC BY 3.0.
RorwXLxZq4uwj1
Interaktywna gra, polegająca na łączeniu wyrazów w pary w ciągu jednej minuty. Czas zaczyna upływać wraz z rozpoczęciem gry. Jeden ruch to odkrywanie najpierw jednej potem drugiej karty z wyrazem. Każdy wyraz jest odczytywany. Kolejny ruch to odkrywanie trzeciej i czwartej karty. W ten sposób odsłuchasz wszystkie wyrazy. Nawigacja z poziomu klawiatury za pomocą strzałek, odsłuchiwanie wyrazów enterem lub spacją. Znajdź wszystkie pary wyrazów.
Interaktywna gra, polegająca na łączeniu wyrazów w pary w ciągu jednej minuty. Czas zaczyna upływać wraz z rozpoczęciem gry. Jeden ruch to odkrywanie najpierw jednej potem drugiej karty z wyrazem. Każdy wyraz jest odczytywany. Kolejny ruch to odkrywanie trzeciej i czwartej karty. W ten sposób odsłuchasz wszystkie wyrazy. Nawigacja z poziomu klawiatury za pomocą strzałek, odsłuchiwanie wyrazów enterem lub spacją. Znajdź wszystkie pary wyrazów.
Match Polish terms with their English equivalents.
monitoring
monitorowanie
diagnostyka
diagnostics
wydajno��
performance
Source: Zespół autorski Politechniki Łódzkiej, licencja: CC BY 3.0.