Climate characteristics based on meteorological data
what is the significance of the Earth’s axial tilt for the differentiation of the illumination of the globe;
how the Earth’s revolving around the Sun contributes to the change of seasons.
what a climatogram is;
how to create a climatogram based on a table with data;
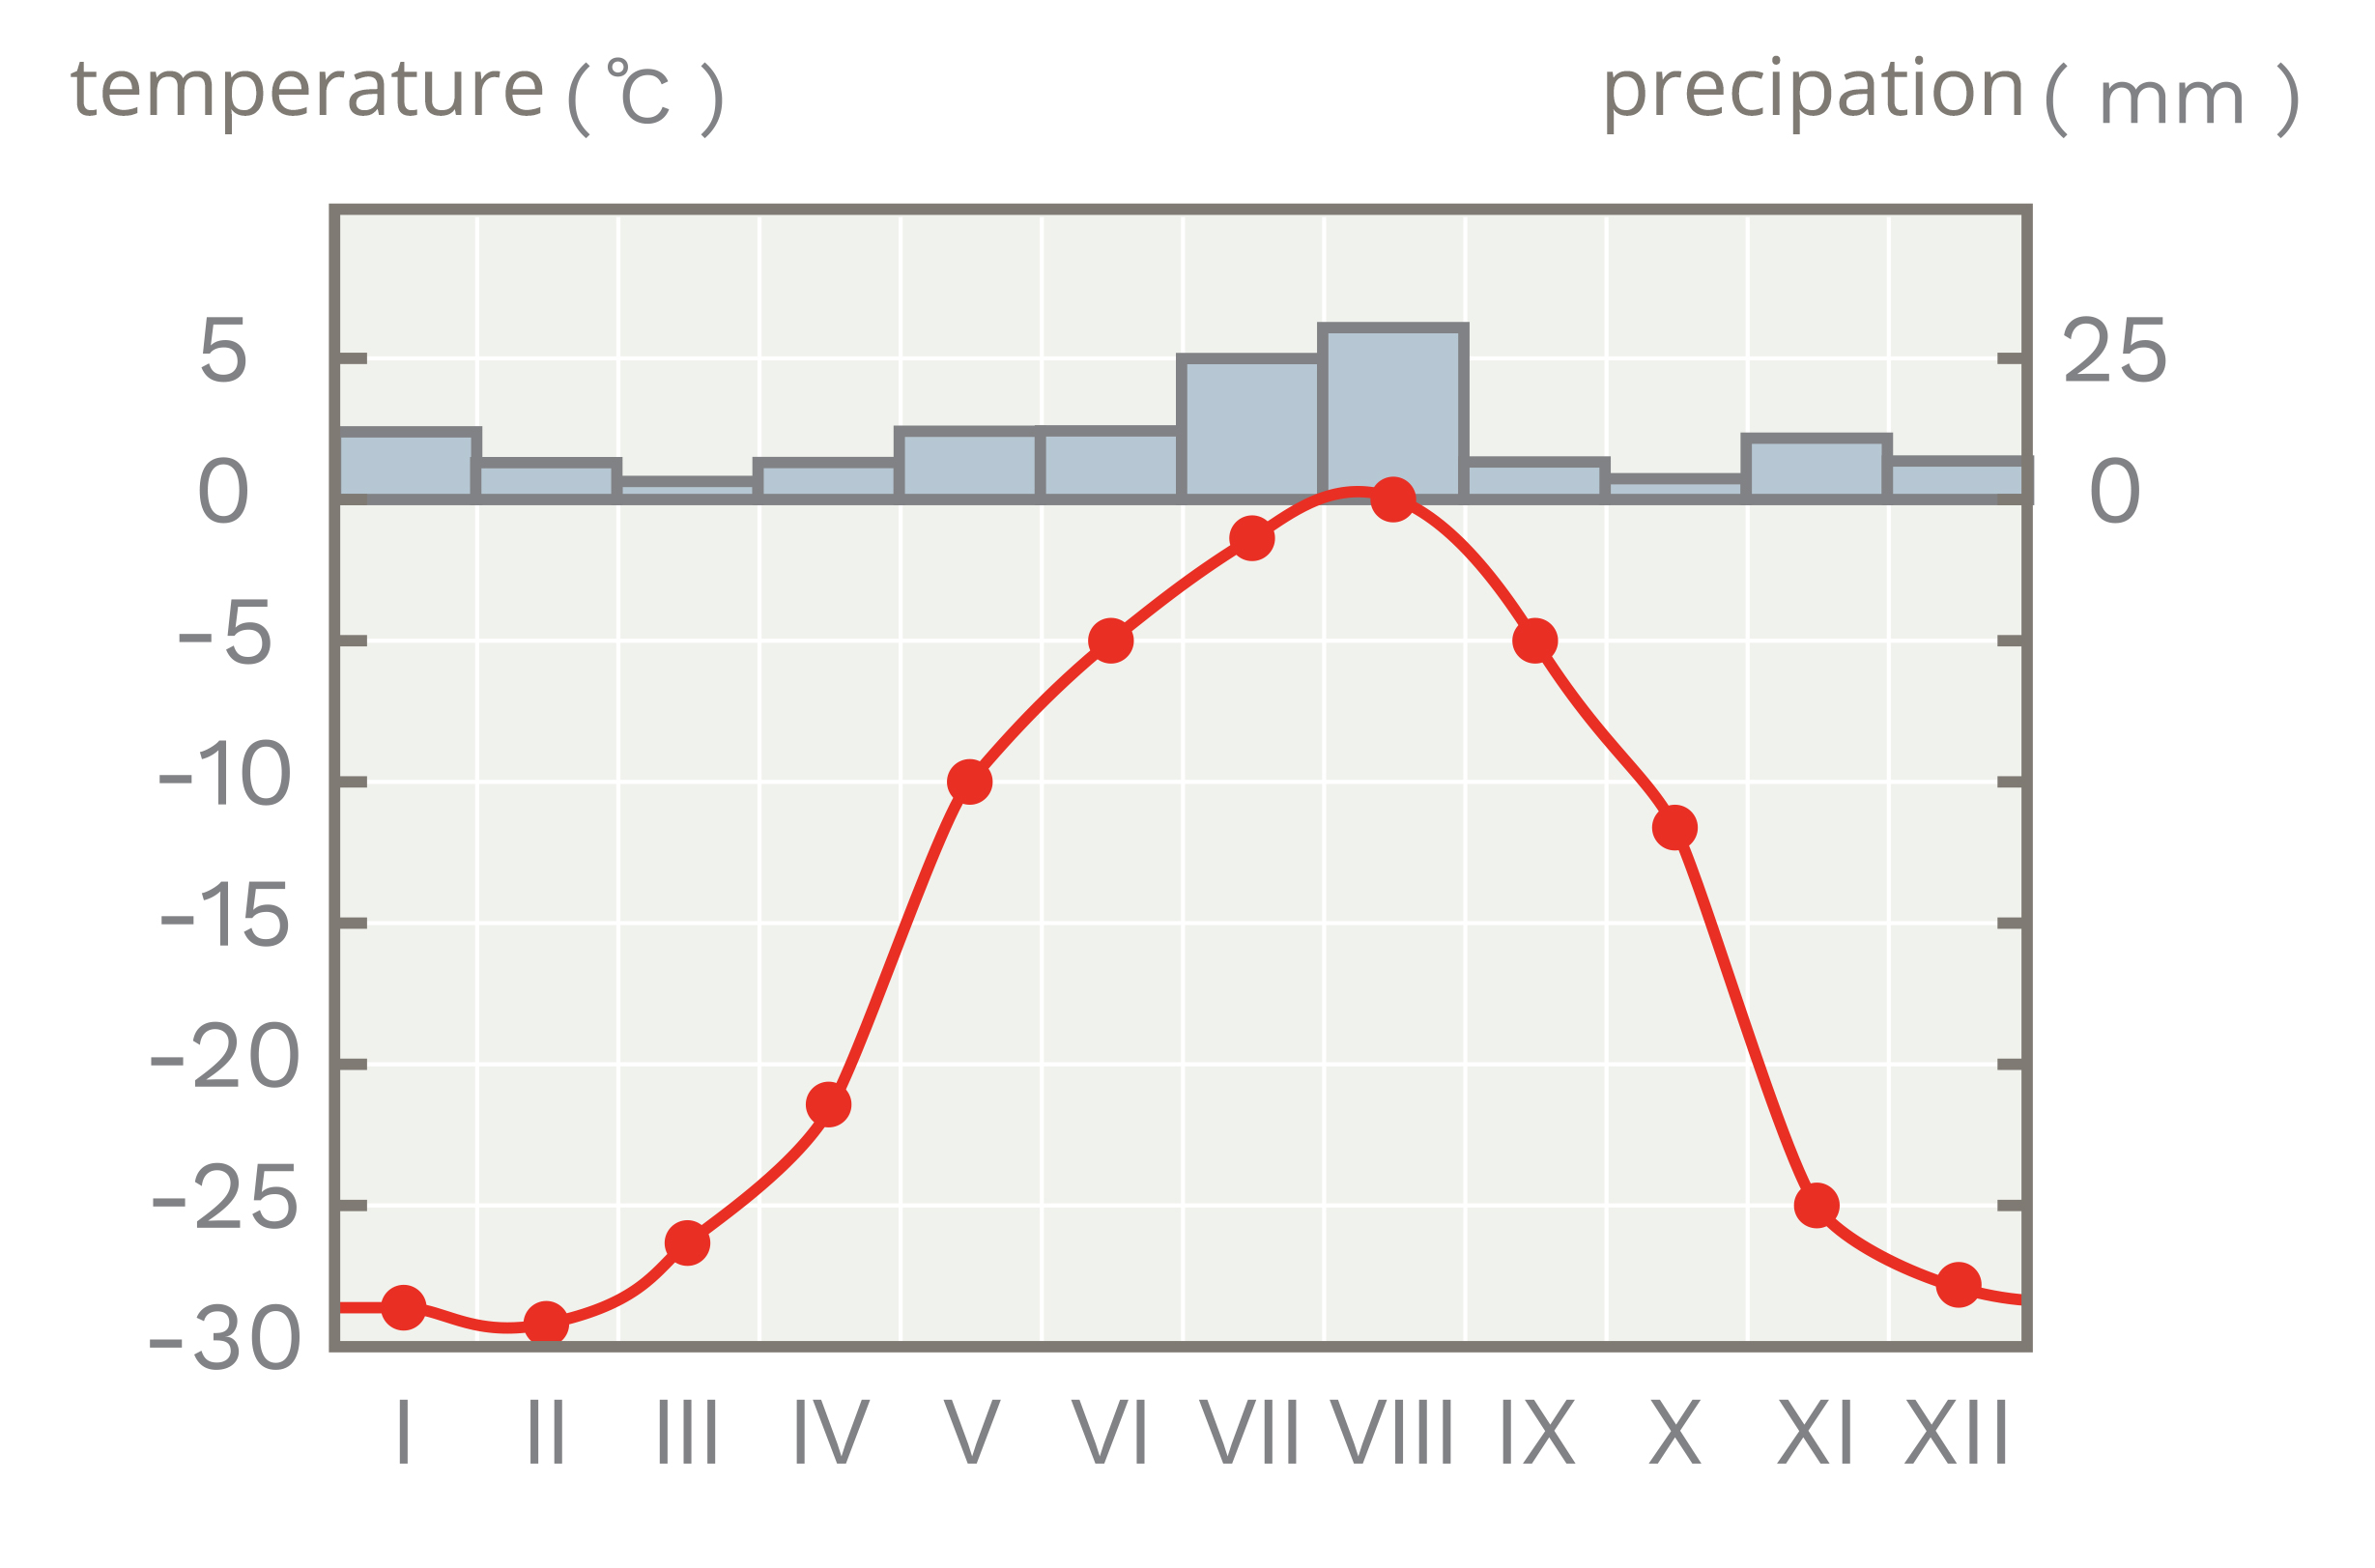
how to read information on annual distribution of air temperature and precipitation from a climatogram.
What is used to detect the weather? Write down your answers below.

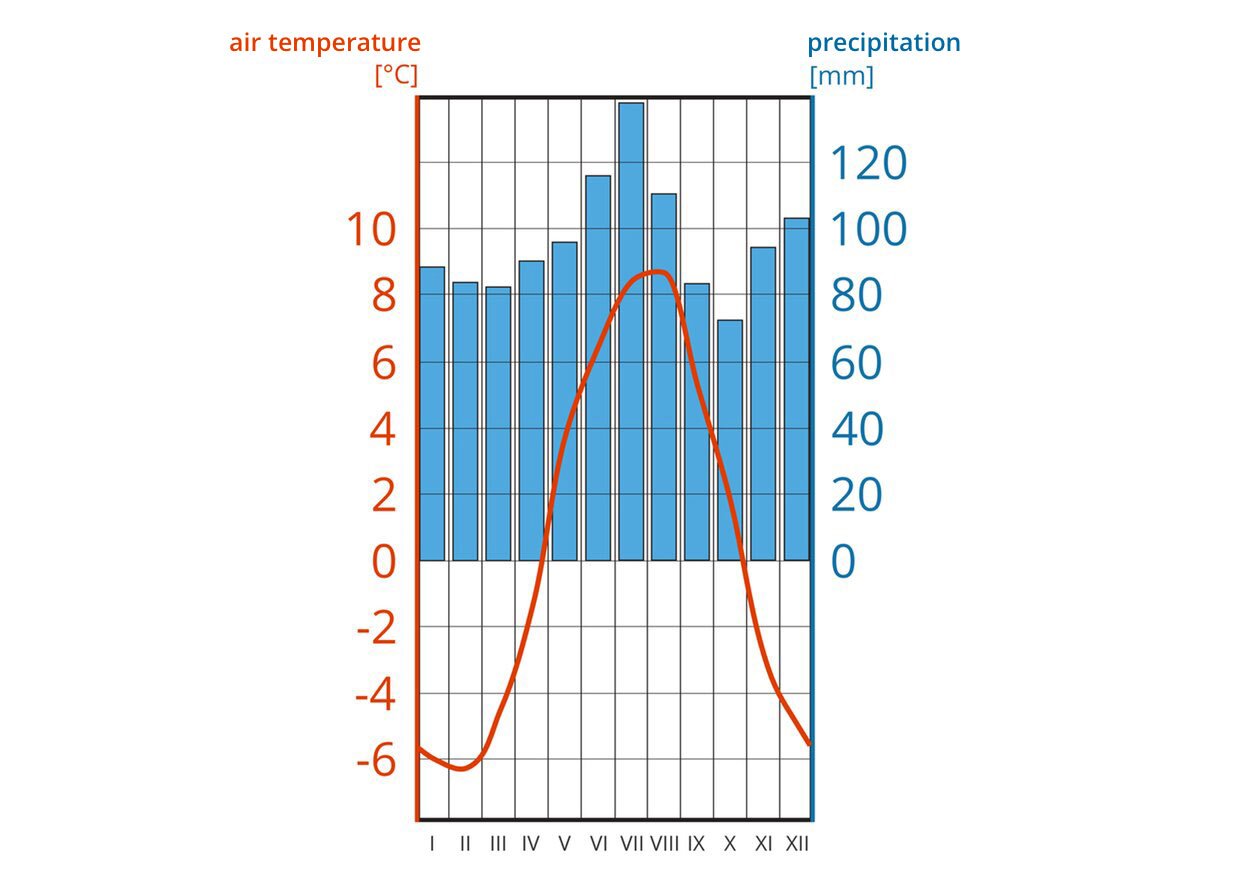
The ability to measure, record and display climate data allows us to analyse climate conditions on Earth. It is best to present many different components of the climate with great accuracy. Very helpful in the analysis of the climate are graphs showing the air temperature and precipitation patterns at a given location and time (usually a year), called climatogramsclimatograms (climate charts or diagrams). Data presented in climate charts are averages from several decades of measurements and often show monthly averages, thus not taking into account extreme phenomena – particularly strong frosts or heat waves, torrential rains or extraordinary droughts. Average values can sometimes be confusing. In tropical deserts one can encounter very large daily air temperature amplitudes. If the temperature rises to +40°C during the day and falls to 0°C during the night, then on average we obtain a very pleasant temperature of 20°C. Therefore, a climatogram is not sufficient for the correct description of the climate and additional information is necessary. Below is an example of a climatogram created on the basis of data from a long‑term period (1971‑2000), collected at the Tadeusz Hołdys High Mountain Meteorological Observatory on Śnieżka in the Giant Mountains.
Data on each of the components of the climate (e.g. air temperature, total precipitation, evaporation) are obtained from measurements made several times a day. Next, the daily averages are calculated, then the monthly averages, and finally the annual averages, which can be averaged over a long period of time, if a long time series of observations is available.
I | II | III | IV | V | VI | VII | VIII | IX | X | XI | XII | |
Average monthly air temperatures (°C) | -6.1 | -6.4 | -4.7 | -1.5 | 3.8 | 6.4 | 8.3 | 8.7 | 5.2 | 1.7 | -3.0 | -5.0 |
Total precipitation (mm) | 87 | 84 | 83 | 89 | 94 | 115 | 138 | 108 | 85 | 72 | 93 | 103 |
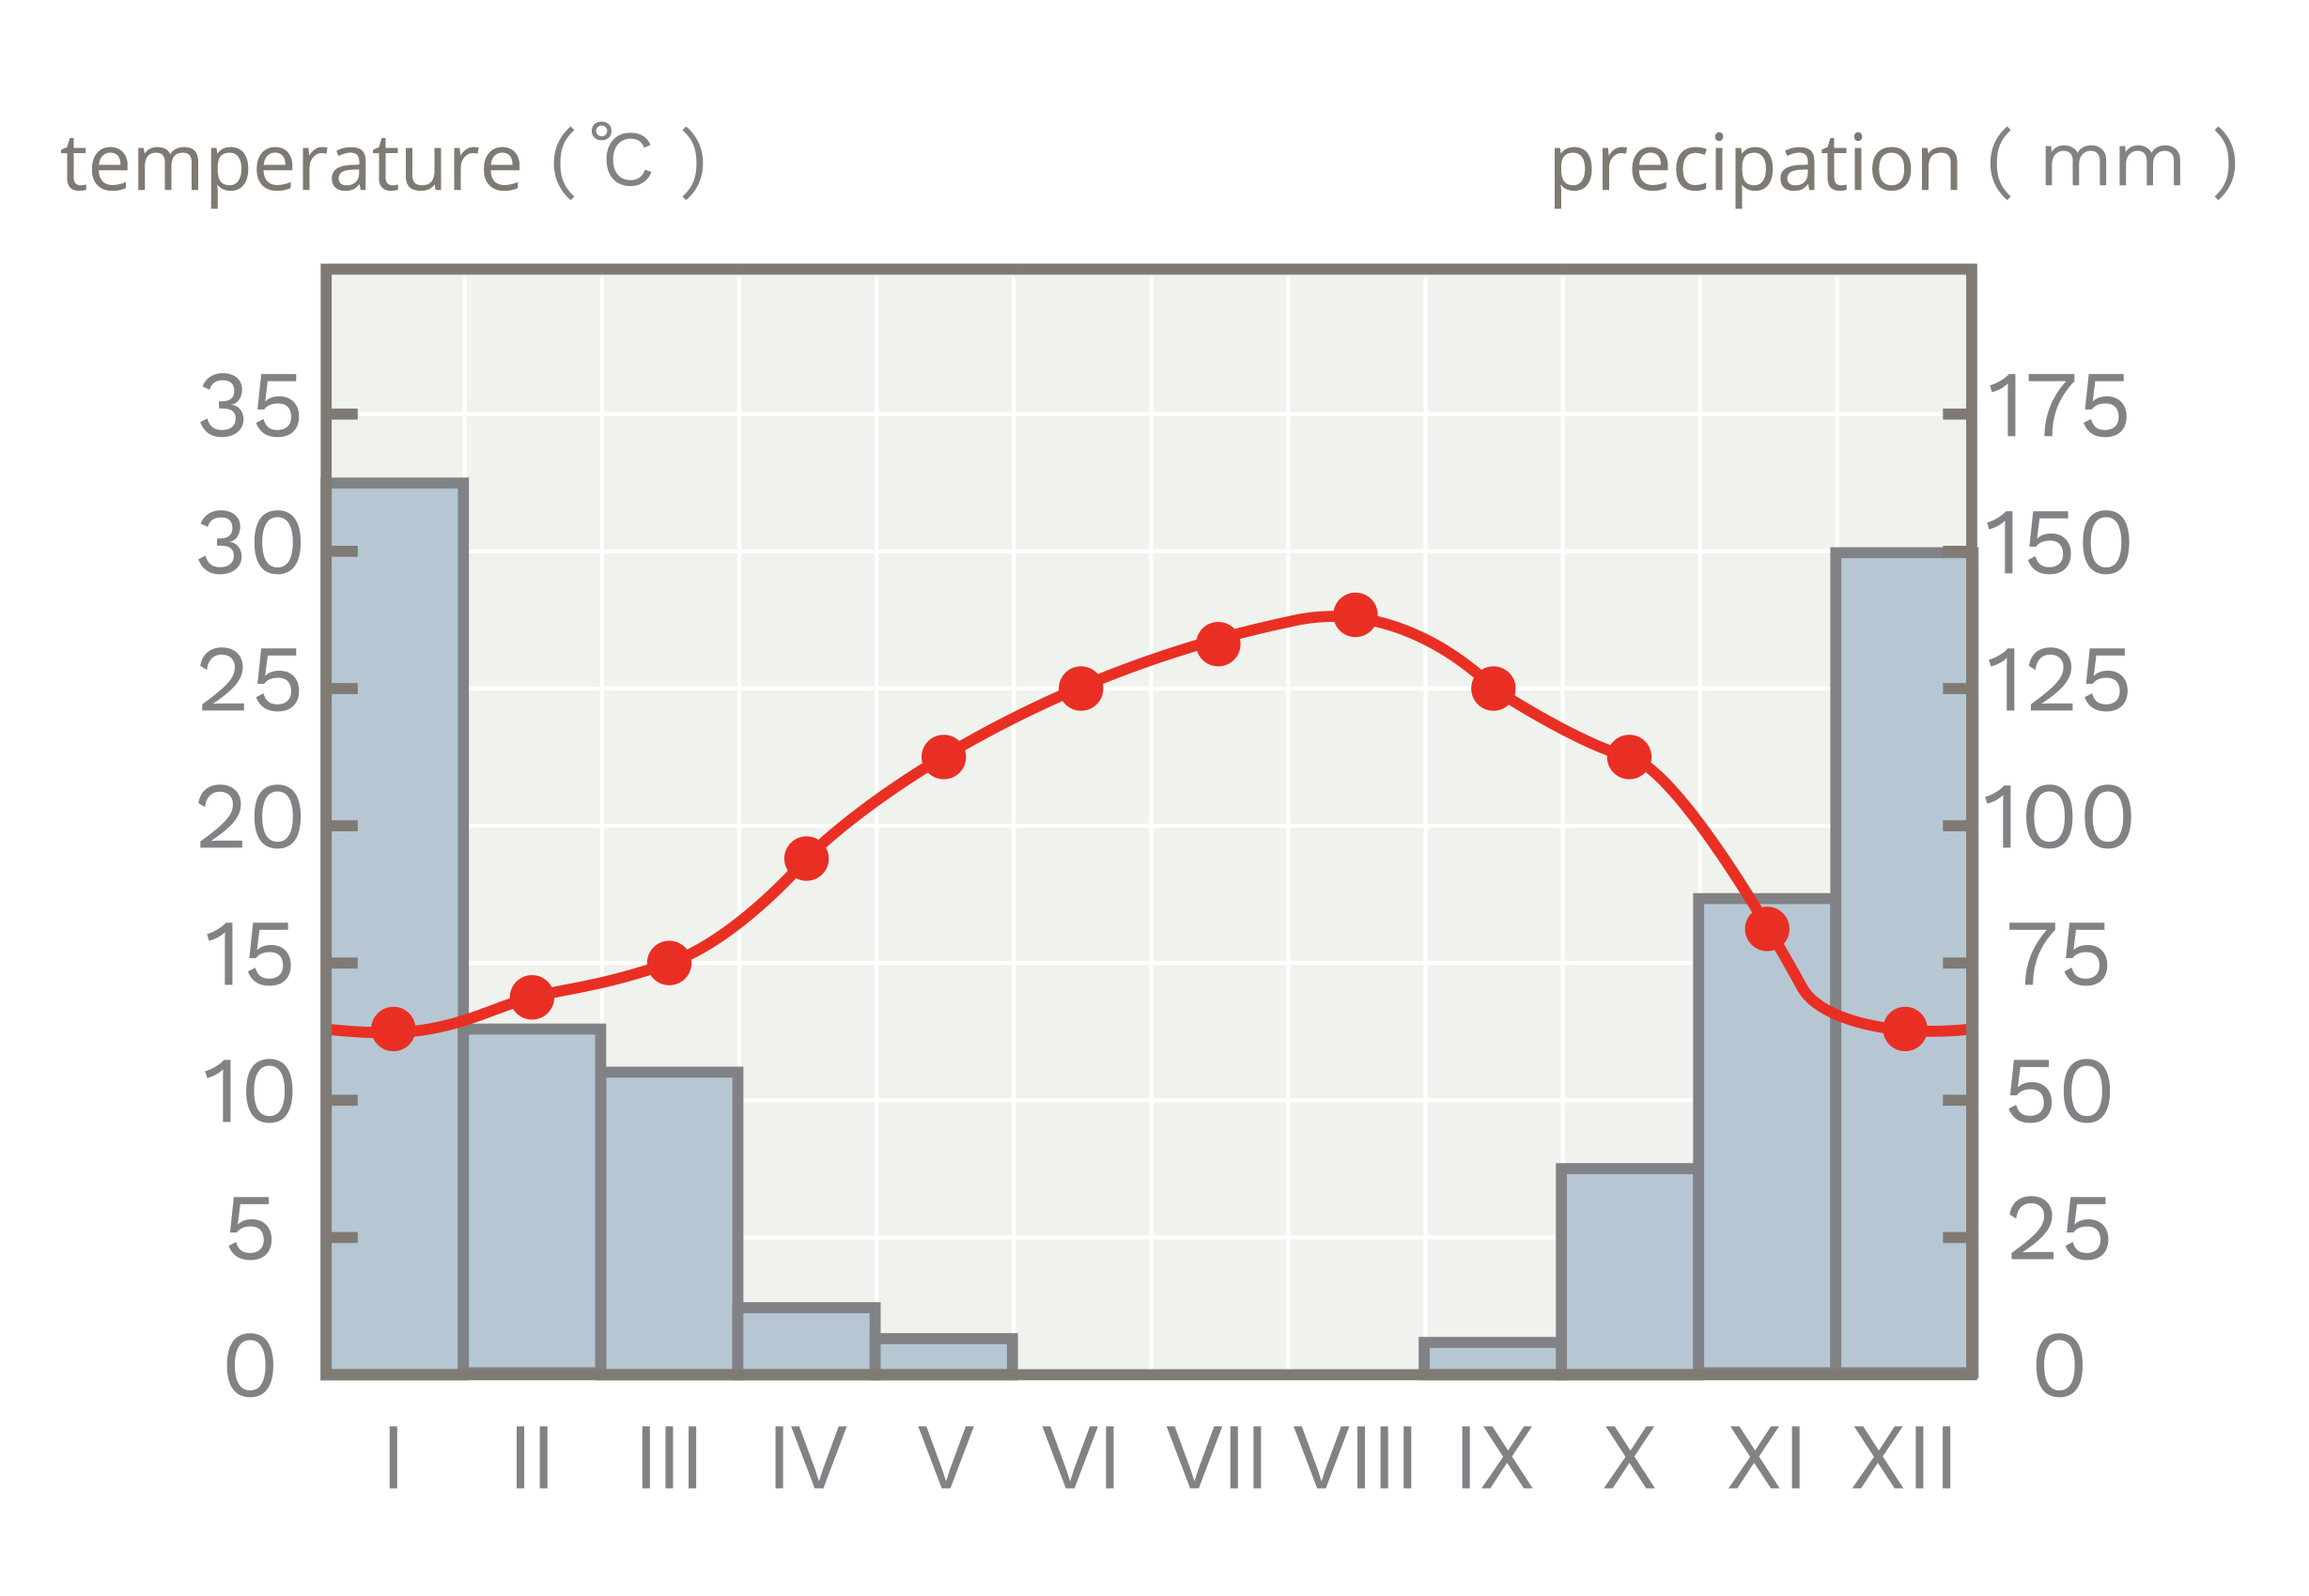
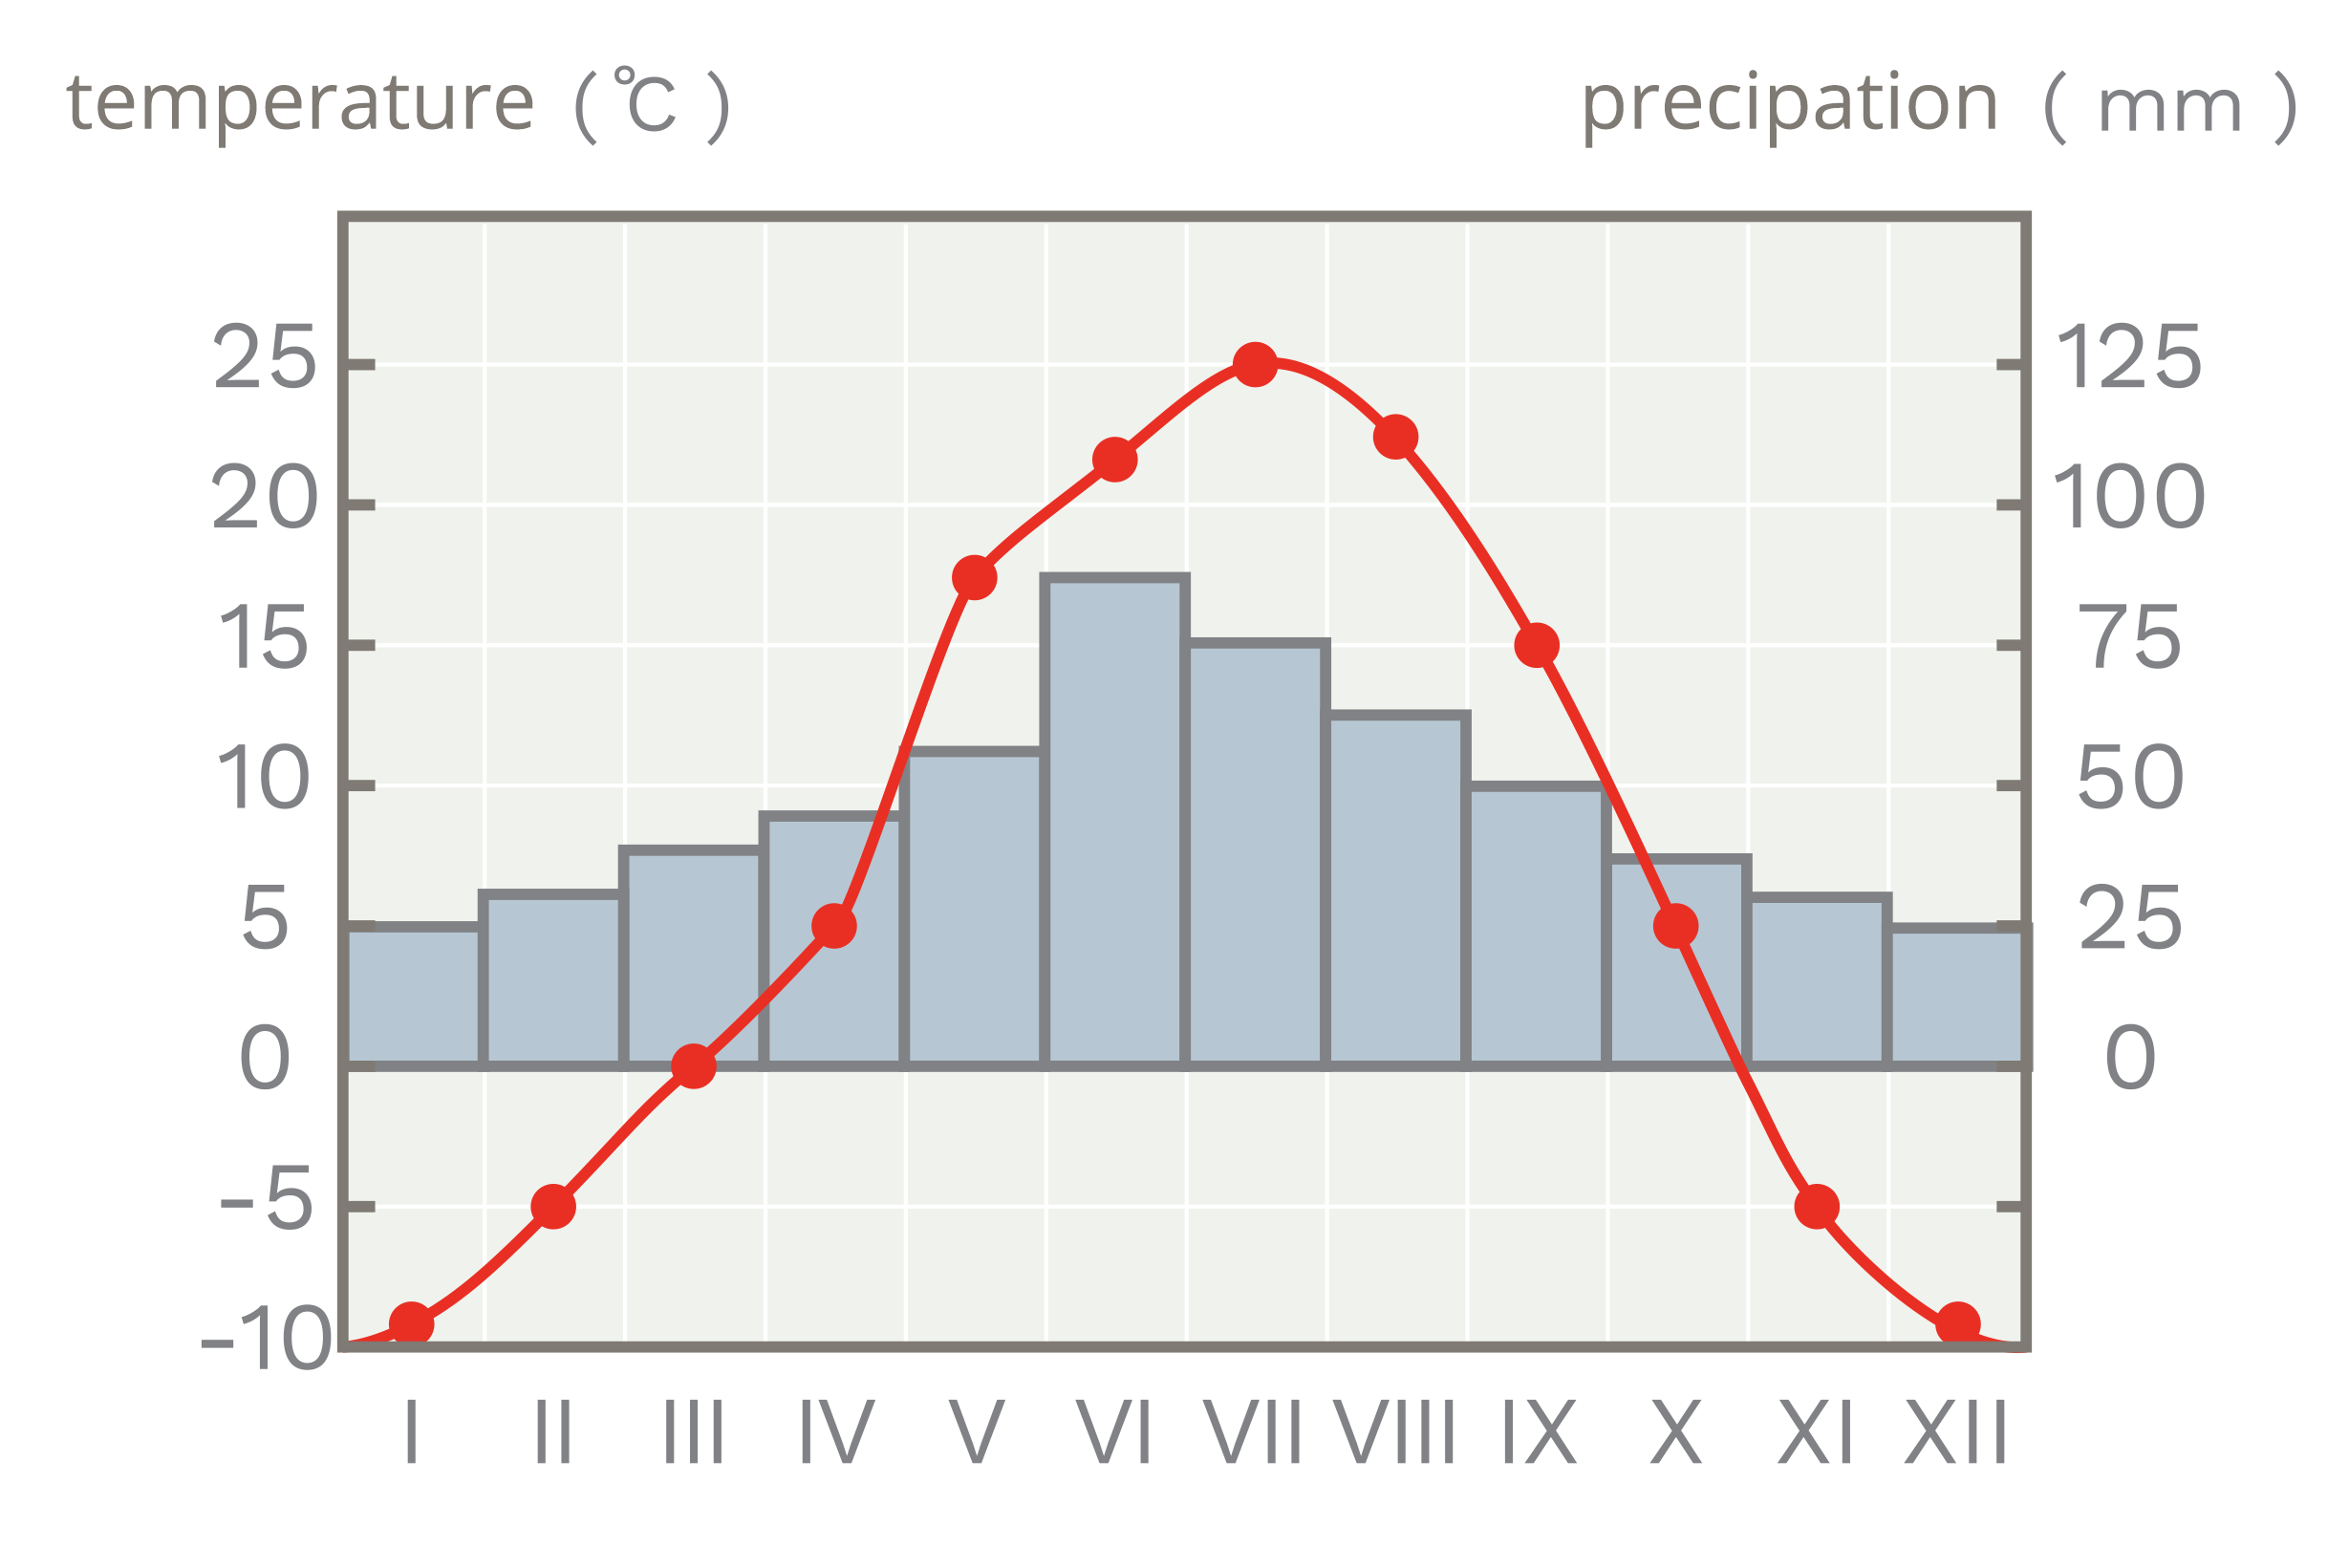
Which climatogram has been created on the basis of data collected in a place with no precipitation at all in the warmest season and an abundance of precipitation in the coldest season?
- Caption of Figure A
- Caption of the correct Figure B
- Caption of Figure C
- Caption of Figure D
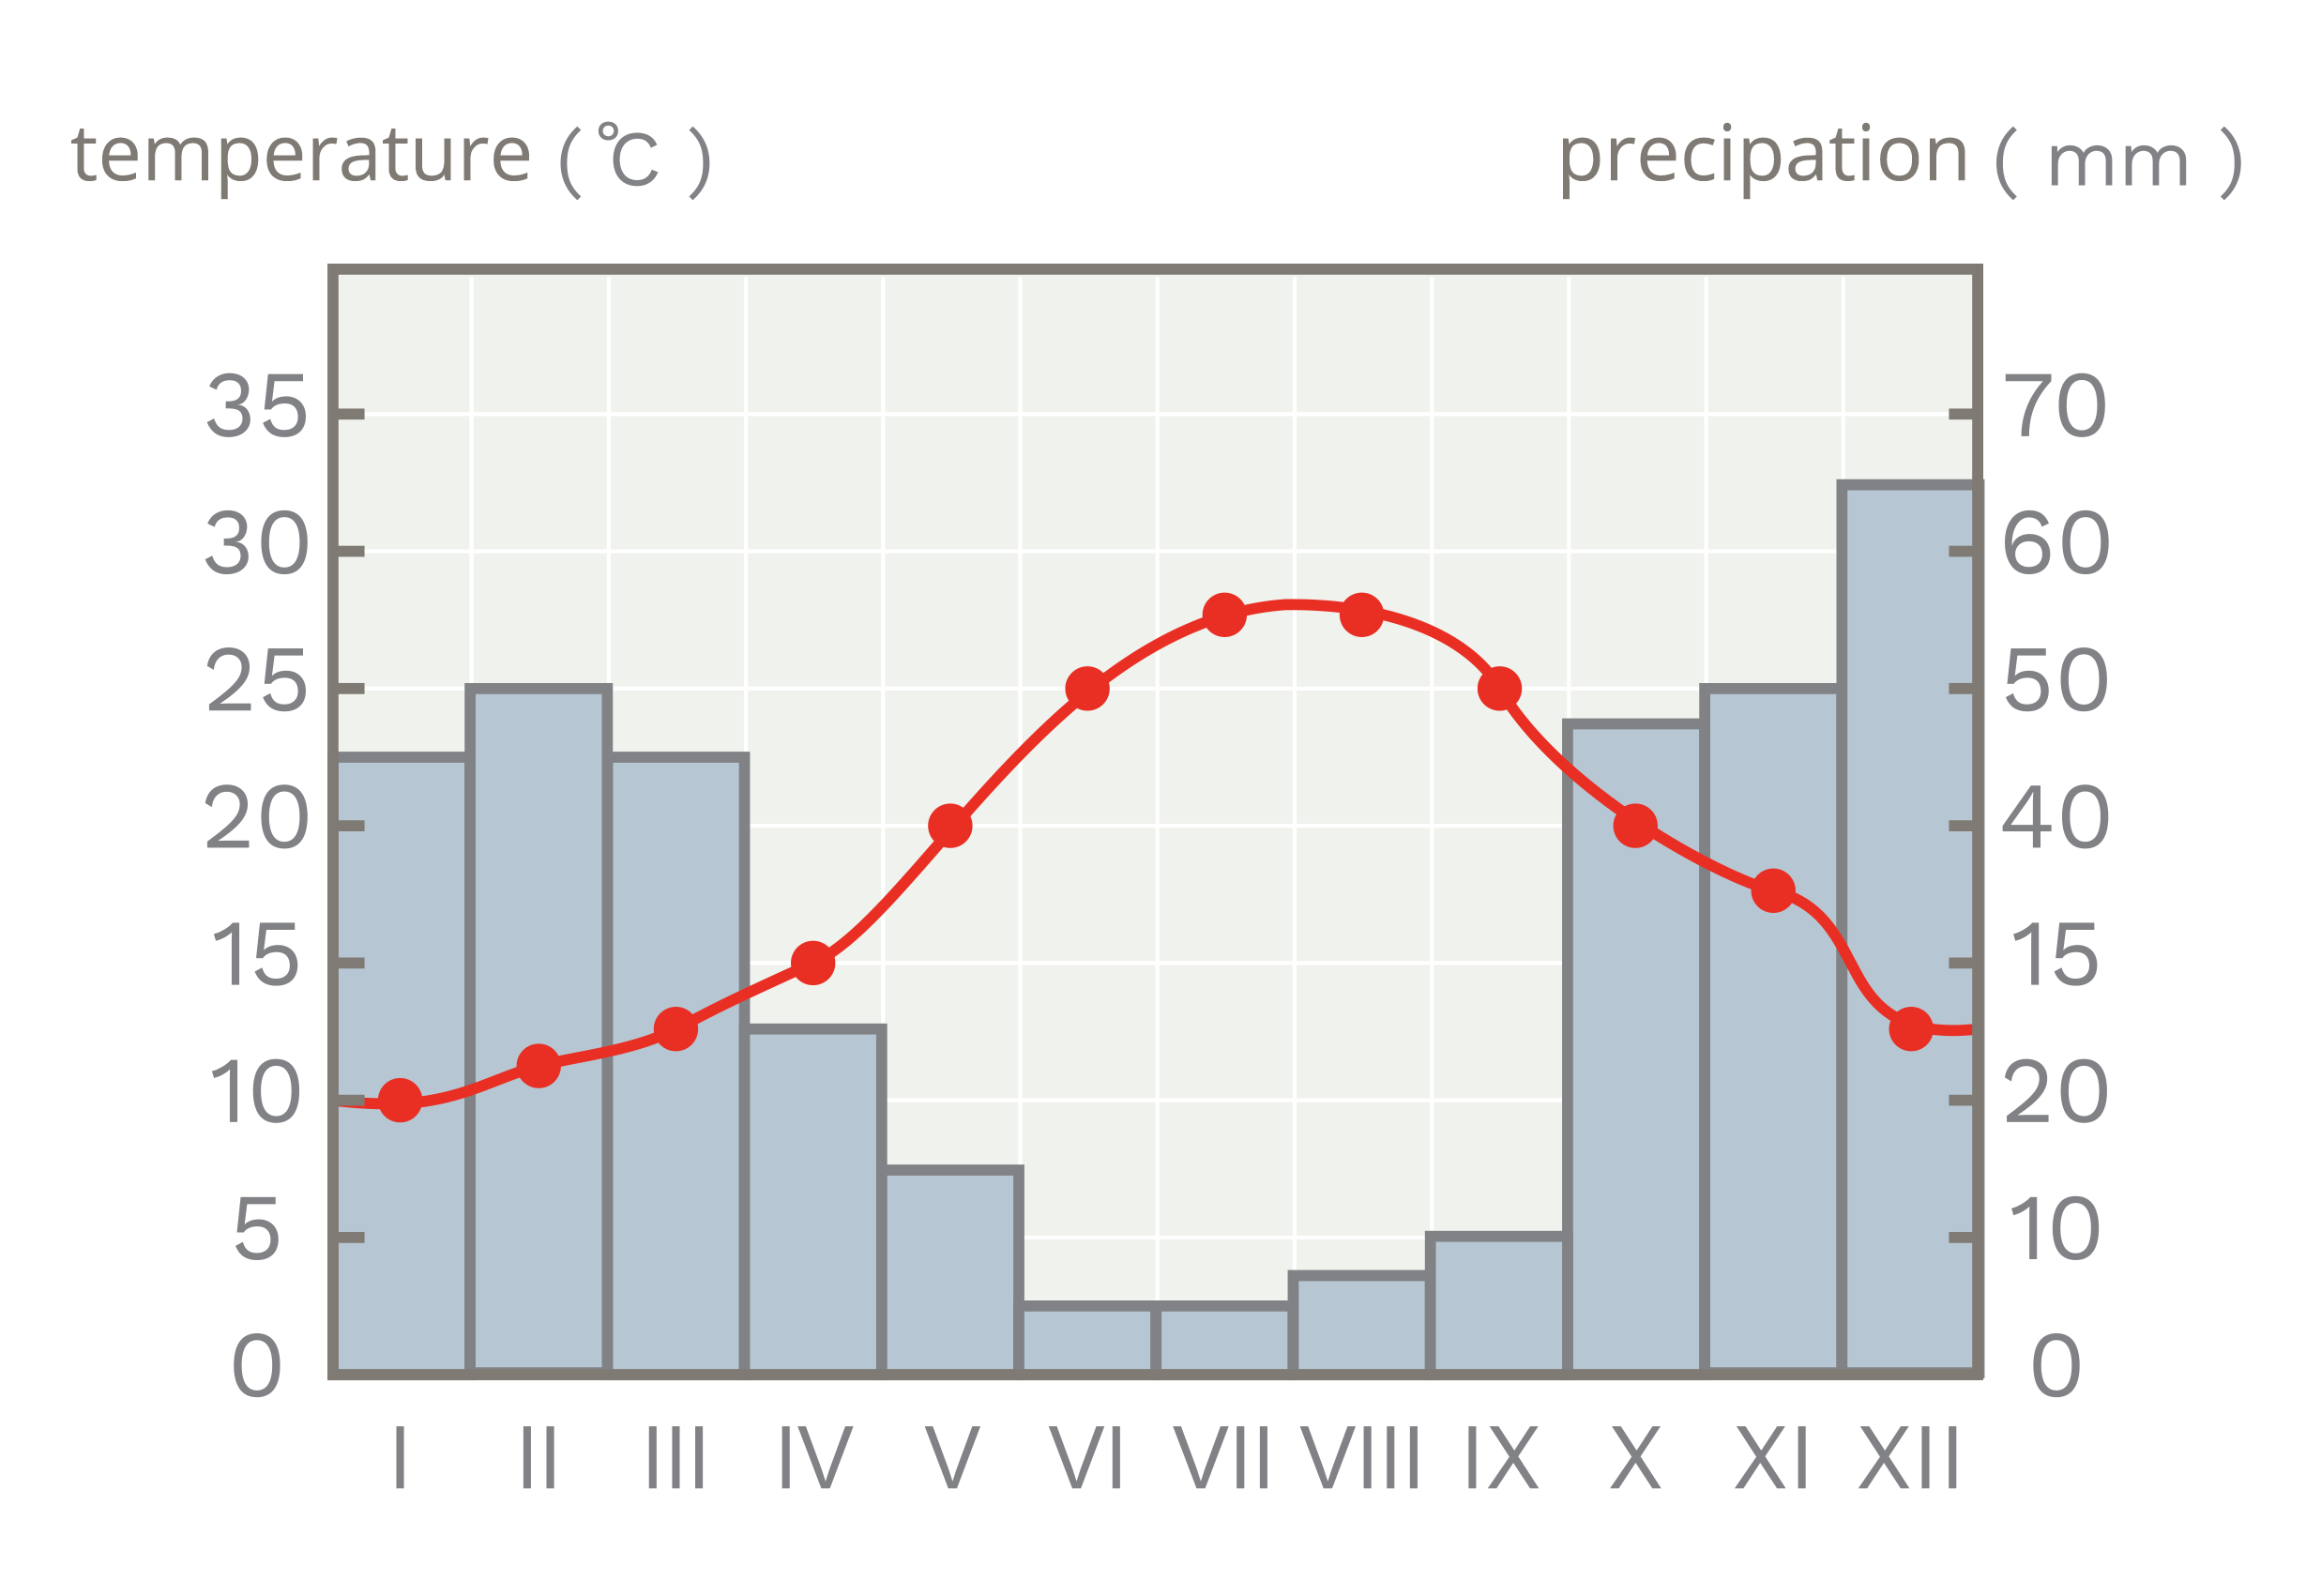
On the basis of the table draw a climatogram.
I | II | III | IV | V | VI | VII | VIII | IX | X | XI | XII | |
Average monthly air temperatures (°C) | -0.9 | 0.2 | 3.9 | 8.2 | 13.5 | 16.3 | 18.1 | 17.8 | 13.6 | 8.9 | 3.6 | 0.7 |
Total precipitation (mm) | 28 | 24 | 30 | 37 | 57 | 79 | 91 | 64 | 51 | 38 | 37 | 34 |
The animation shows how to draw a climograph.

Film dostępny na portalu epodreczniki.pl
Film przedstawia tworzenie klimatografu, creating climatographs. Klimatografy tworzone są na podstawie rozkładu średnich miesięcznych temperatur, average monthly temperatures w stopniach Celsjusza oraz ilości opadów, amount of precipitation w milimetrach. Dane są zbierane w tabeli. Na kartce papieru tworzony zostaje klimatograf. Na lewej osi Y zamieszczane są dane temperatur, na prawej osi Y zamieszczane są dane opadów. Na osi X zamieszczane są informacje o miesiącach. Na wykres nanoszone są dane z tabeli ze wszystkich miesięcy w roku. Wartości temperatur oznaczone zostają punktami, wartości opadów oznacza się słupkami. Na filmie wykorzystane zostały przykładowe dane. Średnie miesięczne temperatury powietrza w stopniach Celsjusza to styczeń 12, luty 13, marzec 15, kwiecień 18, maj 22.5, czerwiec 25, lipiec 28, sierpień 30, wrzesień 25, październik 22,5, listopad 16, grudzień 13. Średnie miesięczne opady w mililitrach na metr kwadratowy, to styczeń 163, luty 63, marzec 55, kwiecień 13, maj 4, czerwiec 0, lipiec 0, sierpień 0, wrzesień 3, październik 15, listopad 90, grudzień 150.
Summary
The weather is determined based on appropriate observations and measurements of its components: air temperature, atmospheric pressure, humidity, precipitation and atmospheric deposits, wind speed and direction, cloudiness, intensity of sunlight, atmospheric phenomena.
Long‑term and systematic measurements of the weather components allow to determine the climate in a given place.
Climatograms are graphic representations of the climate characteristics of a given place.
Keywords
climatogram, climate, distribution of air temperatures
Match the pairs: English words with Polish definition.
ogół zjawisk pogodowych na danym obszarze ustalony na podstawie obserwacji prowadzonych przez kilkadziesiąt lat, wykres służący przedstawieniu wybranych cech klimatu, najczęściej temperatury i opadów danego miejsca
| climate | |
| climatogram |
Glossary
klimat – ogół zjawisk pogodowych na danym obszarze ustalony na podstawie obserwacji prowadzonych przez kilkadziesiąt lat
klimatogram – wykres służący przedstawieniu wybranych cech klimatu, najczęściej temperatury i opadów danego miejsca