Analyse the results of the same test using two methods as noted above.
Rq89XN1zYuiQ91
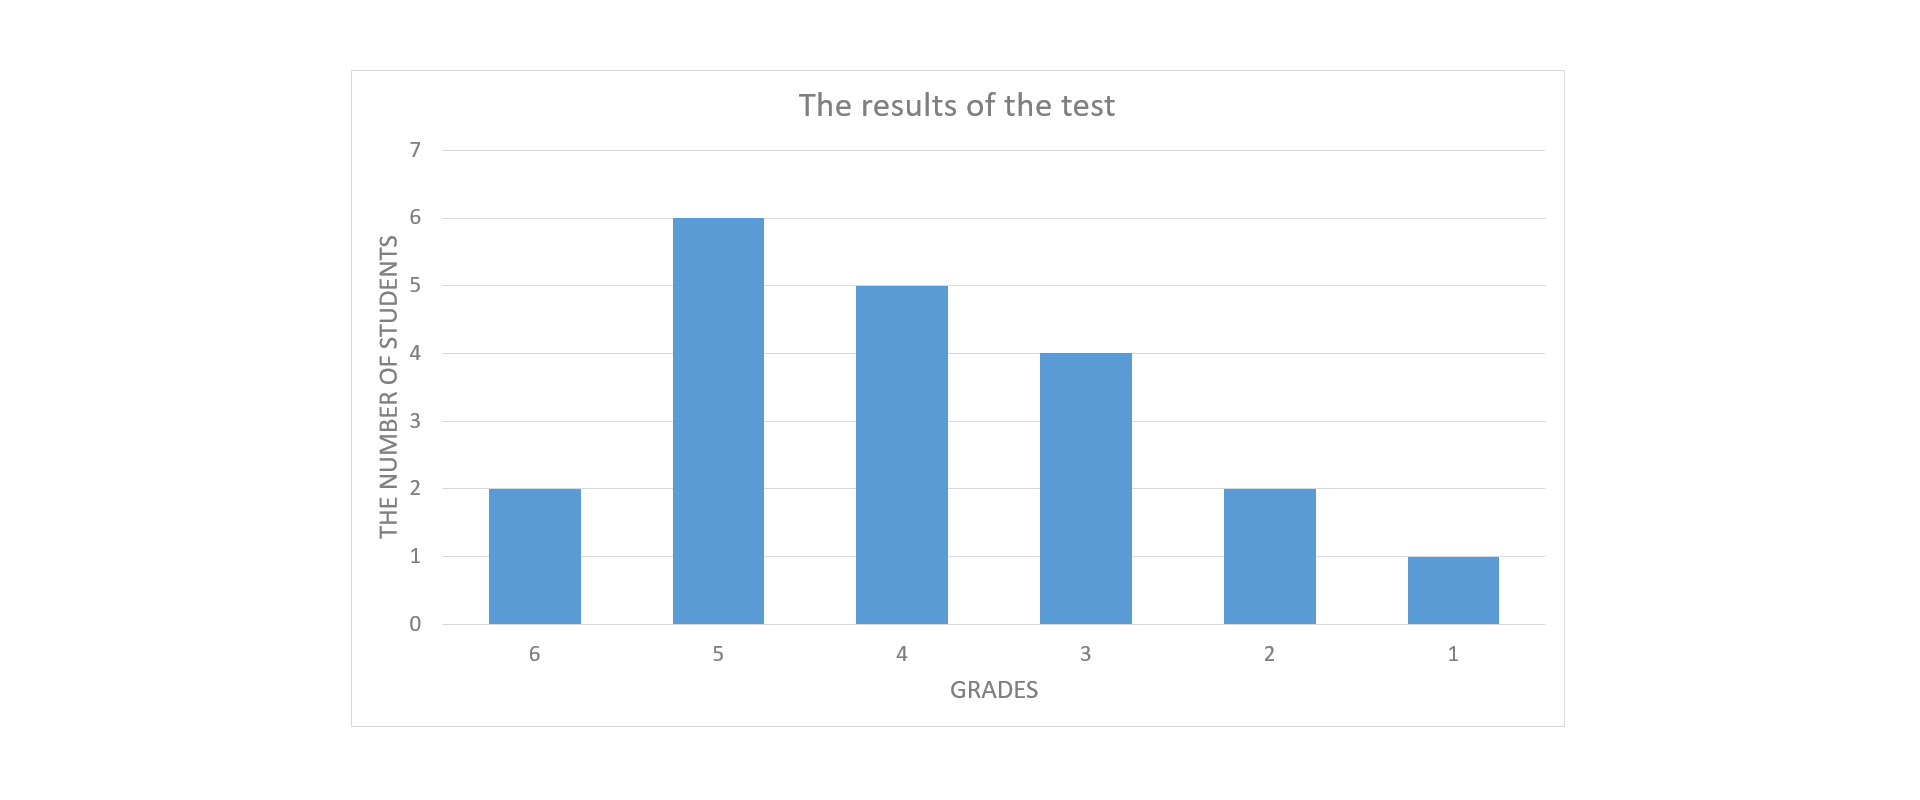
Rysunek przedstawia diagram słupkowy The results of the test. Oś pionowa od 0 do 7 podpisana The number of students. Oś pozioma od 6 do 1 podpisana Grades. Słupek nad 6 wysokości 2, słupek nad 5 wysokości 6, słupek nad 4 wysokości 5, słupek nad 3 wysokości 4, słupek nad 2 wysokości 2, słupek nad 1 wysokości 1.
Source: GroMar, licencja: CC BY 3.0.
R5QDDOIZoiH9T1
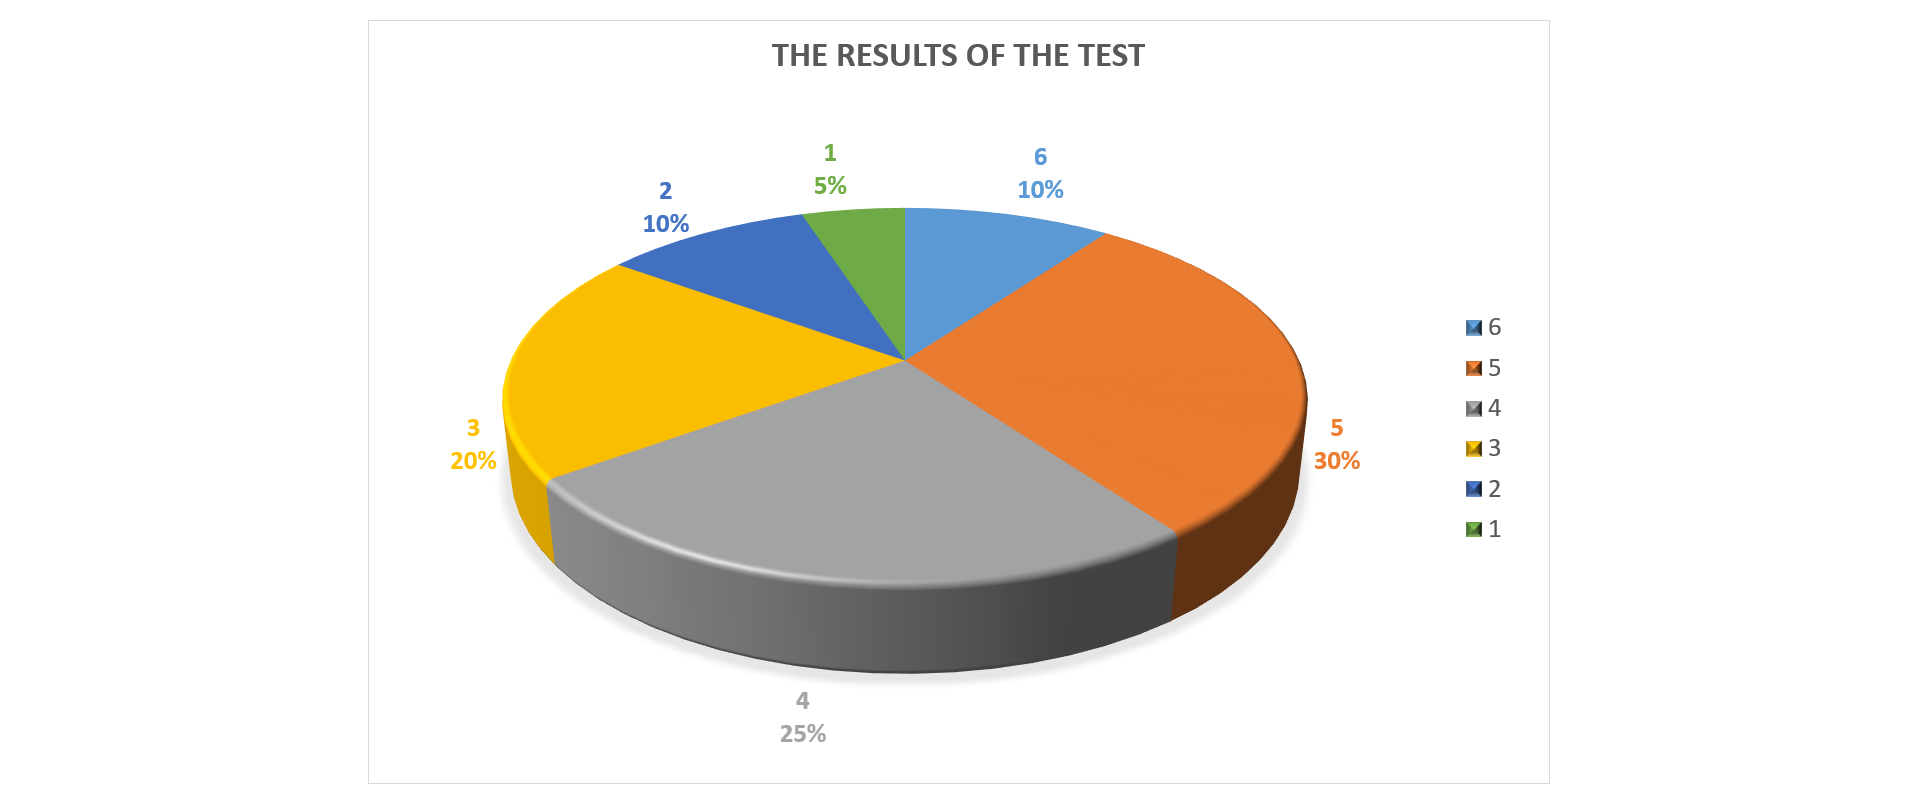
Rysunek przedstawia diagram procentowy: The results of the test. Ocena 6 - 10 procent, ocena 5 - 30 procent, ocena 4 - 25 procent, ocena 3 - 20 procent, ocena 2 - 10 procent, ocena 1 - 5 procent. Po prawej stronie legenda: oceny od 6 do 1 i odpowiadające im kolory na diagramie.
Source: GroMar, licencja: CC BY 3.0.
Consider what information you can get by reading each diagram:
what mark the majority and the minority of the students got,
which marks have the same number,
the number of students who got 3 was lesser or greater than the students who got 2.
Some of the information is easier to read by using one type of diagramdiagramdiagram.
By using the bar diagram you can read the following information:
the number of grades 6,
the number of students who wrote the test,
how many more grades 5 than 3 there were.
By using the pie chart you can read the following information:
the percentage of students who got grade 5,
whether the students who have got the grade 5 represent half of all the students writing the test.
The students present in the pie chartpie chartpie chart the datadatadata from the bar diagramdiagramdiagram concerning the percentage of students who took part in the interest groups.
At Ann’s school every student of grades 4‑8 takes part in a one of the interest groups. Look at the bar diagramdiagramdiagram and read the datadatadata showing the percentage of students taking part in such groups. Present the datadatadata using the pie chartpie chartpie chart.
RIRmn0QigFJpt1
Rysunek przedstawia diagram słupkowy: Participation in the interest groups. Na osi pionowej opisanej [%] skala 0, 5, 10, 15, 20, 25, 30. Na osi poziomej od lewej: math classes wysokości 15, school theatre wysokości 5, student research club wysokości 25, sports activities wysokości 30, sightseeing excursions wysokości 5, art classes wysokości 5, technical training wysokości 5, other wysokości 10.
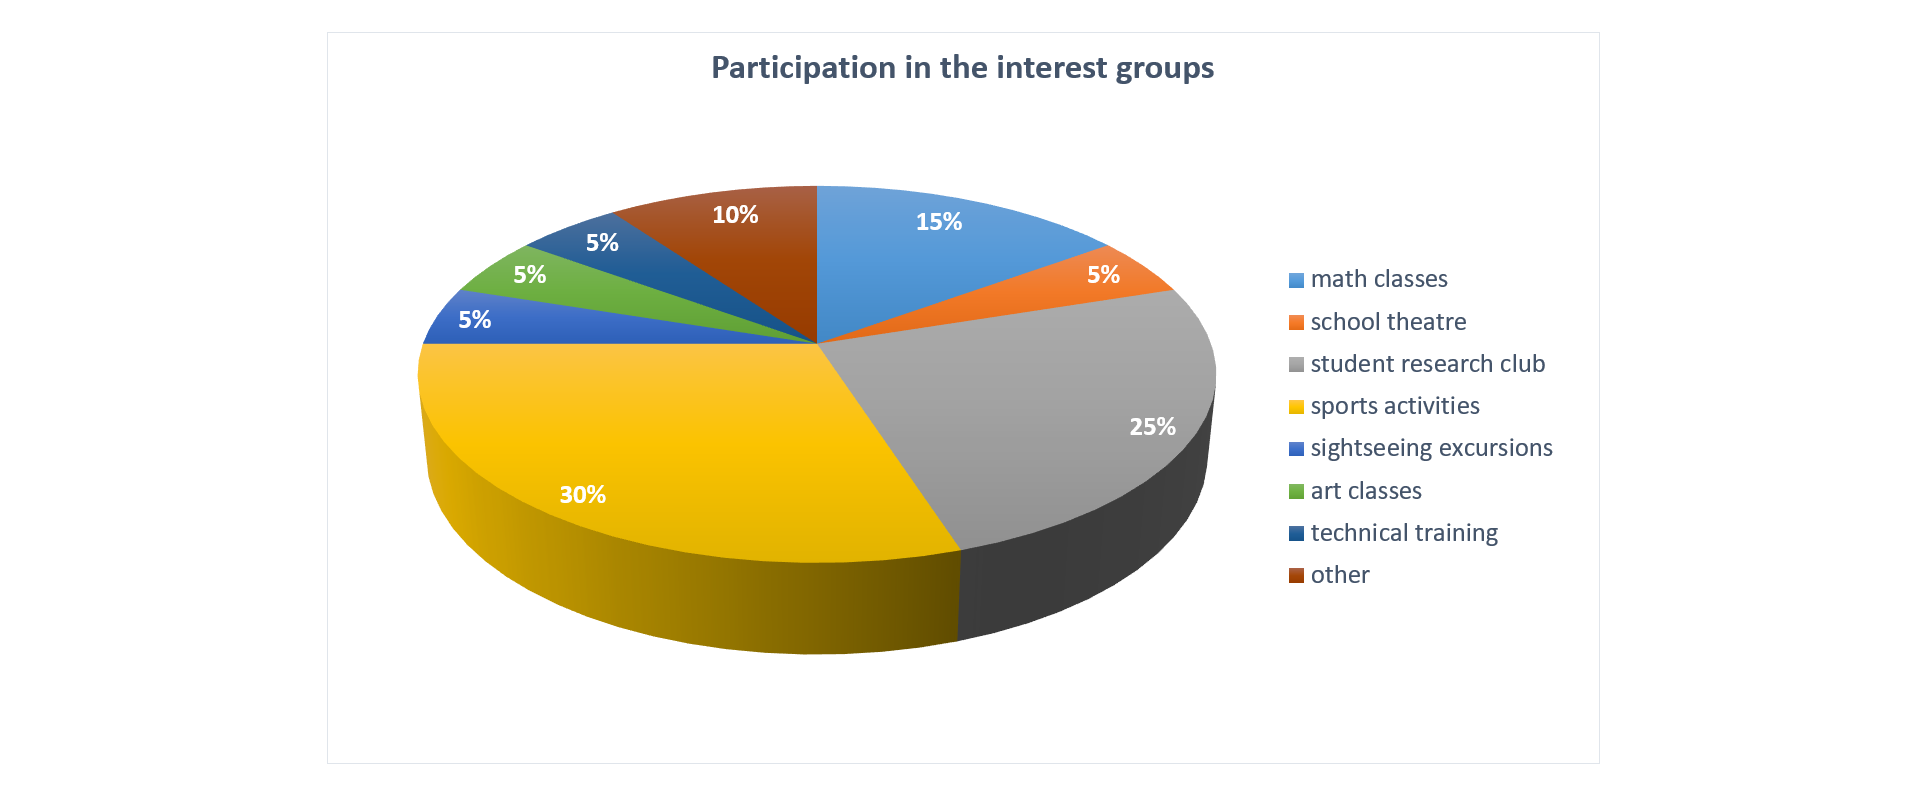
First draw a circle, then mark the particular datadatadata using the percentage protractor. Colour the parts of the circle and make the key of the chart.
RLsR0vYp8fakj1
Rysunek przedstawia diagram procentowy: Participation in the interest groups. Na diagramie zapisy procentowe, po prawej stronie legenda: math classes - 15 procent, school theatre - 5 procent, student research club - 25 procent, sports activities - 30 procent, sightseeing excursions - 5 procent, art classes - 5 procent, technical training - 5 procent, other - 10 procent.
Coniferous trees cover 78% of the state forests in Poland. The rest of the area is occupied by deciduous trees. Present these datadatadata using the pie chartpie chartpie chart.
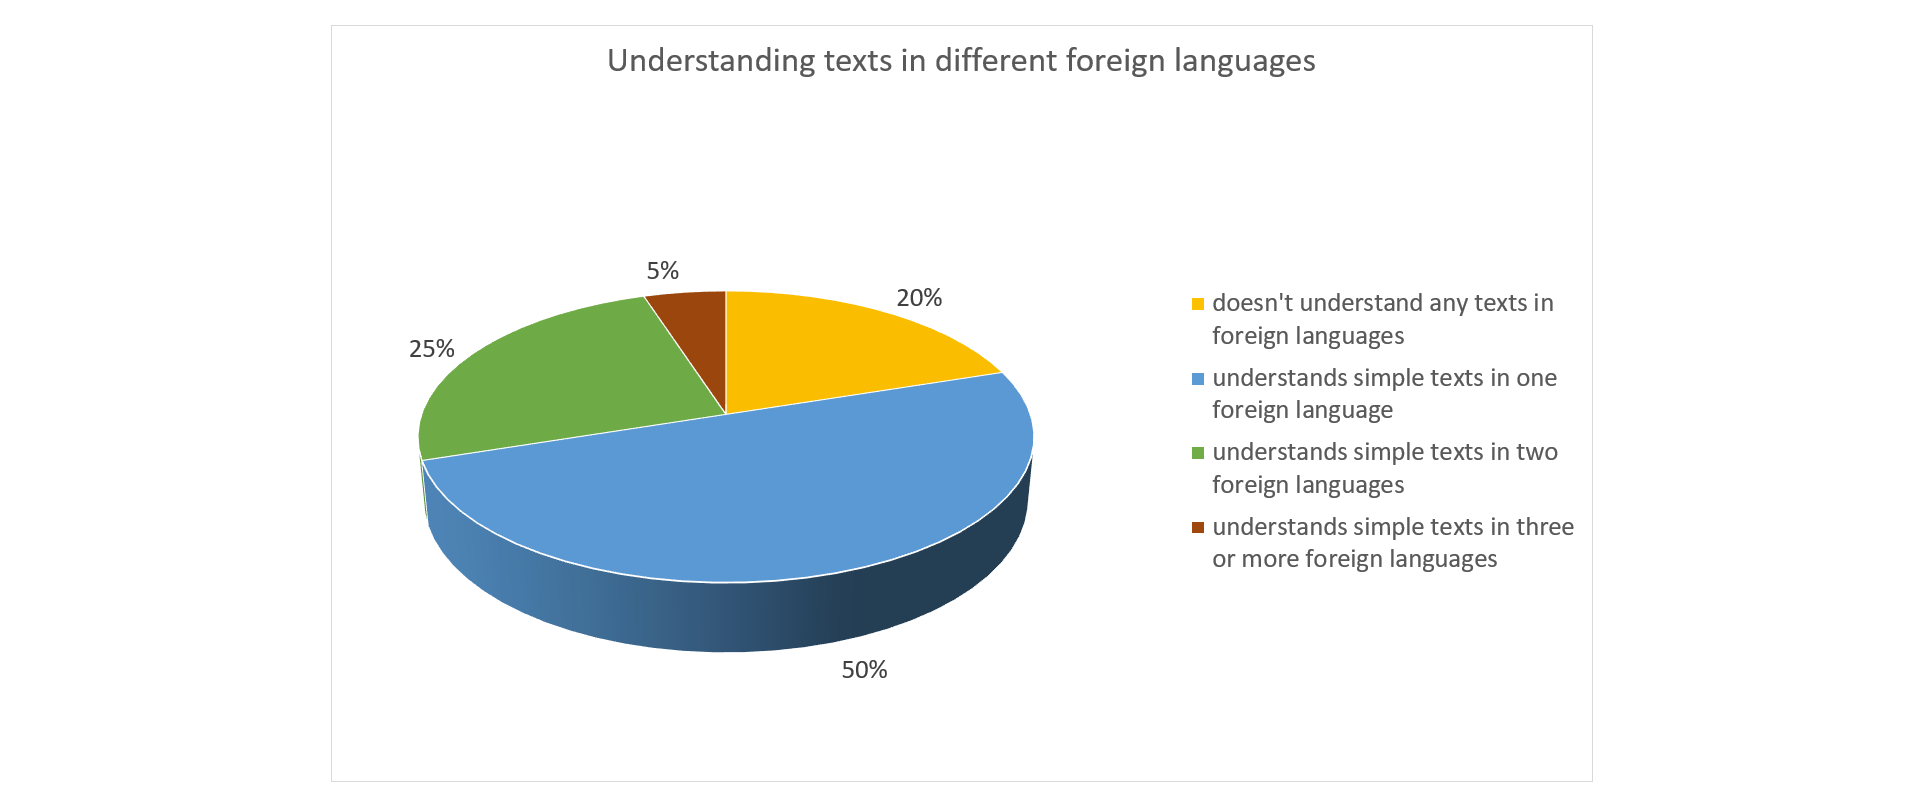
The survey concerning the understanding of simple texts in different foreign languages was conducted among 20 students. The result of the survey was presented in the following diagrams:
R1BI4xlq2cG8C
Ilustracja interaktywna przedstawia diagram słupkowy: Understanding texts in different foreign languages. Na osi pionowej opisanej: the number of students, skala od 0 do 10. Na osi poziomej od lewej: English – słupek wysokości 6, German - słupek wysokości 10, Russian - słupek wysokości 4, Spanish - słupek wysokości 2, Italian - słupek wysokości 1, other - słupek wysokości 1. Na ilustracji widoczne są numery, a na nich podpisy. 1. English - six {audio}, 2. German - ten {audio}, 3. Russian - four {audio}, 4. Spanish - two {audio}, 5. Italian - one {audio}, 6. other - one {audio}.
Ilustracja interaktywna przedstawia diagram słupkowy: Understanding texts in different foreign languages. Na osi pionowej opisanej: the number of students, skala od 0 do 10. Na osi poziomej od lewej: English – słupek wysokości 6, German - słupek wysokości 10, Russian - słupek wysokości 4, Spanish - słupek wysokości 2, Italian - słupek wysokości 1, other - słupek wysokości 1. Na ilustracji widoczne są numery, a na nich podpisy. 1. English - six {audio}, 2. German - ten {audio}, 3. Russian - four {audio}, 4. Spanish - two {audio}, 5. Italian - one {audio}, 6. other - one {audio}.
Understanding texts in different foreign languages
Source: GroMar, licencja: CC BY 3.0.
RRkHL0swepPyH1
Rysunek przedstawia diagram procentowy: Understanding texts in different foreign languages. 20 procent - doesn't understand any texts in foregin languages, 50 procent - understands simple texts in one foregin language, 25 procent - understands simple texts in two foregin languages, 5 procent - understands simple texts in three or more foregin languages,
While drawing a pie chartpie chartpie chart don’t forget about the title and the key. Check what you have learned by doing the summarising tasks.
Exercises
Exercise 1
The bar diagram presents the monthly salaries of the employees of a company. The title of the bar diagram: The amount of the salary.
R1JchqmDFWTGp1
Rysunek przedstawia diagram słupkowy: The amount of the salary. Oś pionowa opisana od 0 do 40 procent co 5 procent. Oś pozioma podpisana [PLN], od lewej: 1800 - odpowiadający słupek wysokości 13 procent, 2500 - odpowiadający słupek wysokości 40 procent, 2800 - odpowiadający słupek wysokości 16 procent, 3500 - odpowiadający słupek wysokości 30 procent, 4500 - odpowiadający słupek wysokości 1 procenta.
Source: GroMar, licencja: CC BY 3.0.
R1DGeAnuGCXLz
Wersja alternatywna ćwiczenia: Determine which sentences are true. Możliwe odpowiedzi: 1. More than 50% of the employees earn 2500 PLN or less., 2. The difference between the highest and the lowest salary is 2700 PLN., 3. 99% of employees earn less than 3000 PLN.
Wersja alternatywna ćwiczenia: Determine which sentences are true. Możliwe odpowiedzi: 1. More than 50% of the employees earn 2500 PLN or less., 2. The difference between the highest and the lowest salary is 2700 PLN., 3. 99% of employees earn less than 3000 PLN.
Determine which sentences are true.
More than 50% of the employees earn 2500 PLN or less.
The difference between the highest and the lowest salary is 2700 PLN.
99% of employees earn less than 3000 PLN.
zadanie
Source: GroMar, licencja: CC BY 3.0.
Exercise 2
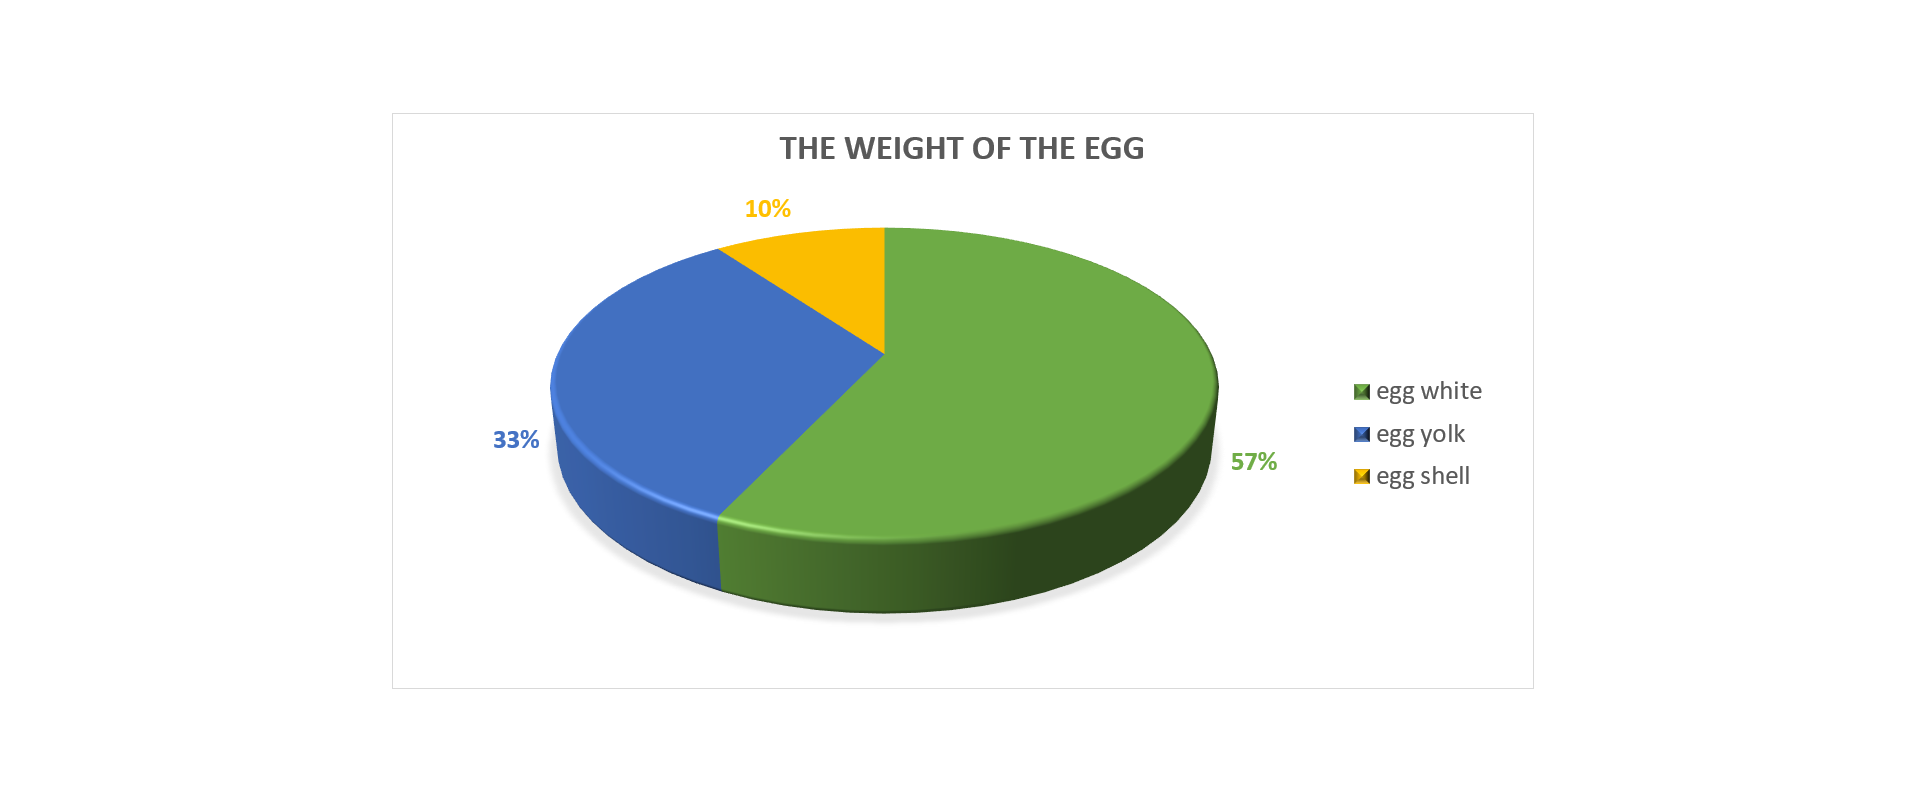
There is 57% of egg white, 33% of yolk in the egg. The remaining part is the eggshell. How many percent of the egg remains for the shell?
Draw a pie chart presenting the data.
The egg shell is 10% of the egg weight.
The pie chart: The weight of the egg
R6Gw1B4tLiZrA1
Rysunek przedstawia diagram procentowy: The weight of the egg. Na diagramie zapisy procentowe, po prawej stronie legenda: egg white - 57 procent, egg yolk - 33 procent, egg shell - 10 procent.
Source: GroMar, licencja: CC BY 3.0.
Exercise 3
25 students of 5Indeks górny thth grade were asked about the number of their siblings. The table below presents the collected data.
The number of the siblings of the students of 5Indeks górny thth grade
The number of the siblings of the students of 5Indeks górny thth grade
without siblings
16%
one
44%
two
28%
three or more
12%
On the basis of the information presented in the table answer the following questions:
a) How many students have got only one sister or one brother?
b) How many families have got more than one child? Draw an appropriate pie chart.
Draw an appropriate pie chart.
In English describe the method of drawing the pie chart.
a) 11 students
b) 10 families
Exercise 4
R1HAVHoCWiI18
Wersja alternatywna ćwiczenia: Indicate which pairs of expressions or words are translated correctly. Możliwe odpowiedzi: 1. dane - data, 2. diagram procentowy - pie chart, 3. obserwacja - observation, 4. tabela - table, 5. zbieranie danych - diagram, 6. diagram - table
Wersja alternatywna ćwiczenia: Indicate which pairs of expressions or words are translated correctly. Możliwe odpowiedzi: 1. dane - data, 2. diagram procentowy - pie chart, 3. obserwacja - observation, 4. tabela - table, 5. zbieranie danych - diagram, 6. diagram - table
Indicate which pairs of expressions or words are translated correctly.
dane - data
diagram procentowy - pie chart
obserwacja - observation
tabela - table
zbieranie danych - diagram
diagram - table
zadanie
Source: GroMar, licencja: CC BY 3.0.
RtKuqPqYpRAXX1
Interaktywna gra, polegająca na łączeniu wyrazów w pary w ciągu jednej minuty. Czas zaczyna upływać wraz z rozpoczęciem gry. Jeden ruch to odkrywanie najpierw jednej potem drugiej karty z wyrazem. Każdy wyraz jest odczytywany. Kolejny ruch to odkrywanie trzeciej i czwartej karty. W ten sposób odsłuchasz wszystkie wyrazy. Nawigacja z poziomu klawiatury za pomocą strzałek, odsłuchiwanie wyrazów enterem lub spacją. Znajdź wszystkie pary wyrazów.
Interaktywna gra, polegająca na łączeniu wyrazów w pary w ciągu jednej minuty. Czas zaczyna upływać wraz z rozpoczęciem gry. Jeden ruch to odkrywanie najpierw jednej potem drugiej karty z wyrazem. Każdy wyraz jest odczytywany. Kolejny ruch to odkrywanie trzeciej i czwartej karty. W ten sposób odsłuchasz wszystkie wyrazy. Nawigacja z poziomu klawiatury za pomocą strzałek, odsłuchiwanie wyrazów enterem lub spacją. Znajdź wszystkie pary wyrazów.
Match Polish terms with their English equivalents.
tabela
table
observation
diagram kołowy
dane
obserwacja
diagram
diagram
pie chart
data
Source: Zespół autorski Politechniki Łódzkiej, licencja: CC BY 3.0.
![Rysunek przedstawia diagram słupkowy: Participation in the interest groups. Na osi pionowej opisanej [%] skala 0, 5, 10, 15, 20, 25, 30. Na osi poziomej od lewej: math classes wysokości 15, school theatre wysokości 5, student research club wysokości 25, sports activities wysokości 30, sightseeing excursions wysokości 5, art classes wysokości 5, technical training wysokości 5, other wysokości 10.](https://static.zpe.gov.pl/portal/f/res-minimized/RIRmn0QigFJpt/1/110R8jHWVnKSsKwdvVji4XjnrTzFzjxN.png)
![Rysunek przedstawia diagram słupkowy: The amount of the salary. Oś pionowa opisana od 0 do 40 procent co 5 procent. Oś pozioma podpisana [PLN], od lewej: 1800 - odpowiadający słupek wysokości 13 procent, 2500 - odpowiadający słupek wysokości 40 procent, 2800 - odpowiadający słupek wysokości 16 procent, 3500 - odpowiadający słupek wysokości 30 procent, 4500 - odpowiadający słupek wysokości 1 procenta.](https://static.zpe.gov.pl/portal/f/res-minimized/R1JchqmDFWTGp/1/desUuLMzf82Xc62bZ5TRTE68ot5045bZ.png)