Demographic processes in the world
what the rate of natural increase is;
how to count the rate of natural increase and in which unit its value is presented;
that the average life expectancy may significantly vary in different parts of the world.
to discuss the stages of the demographic transition;
to give examples of the countries in different phases of demographic transition;
to explain what the population explosion is;
to explain causes for and effects of the population explosion;
to discuss the epidemiological transition model.
Historical changes in the world's population
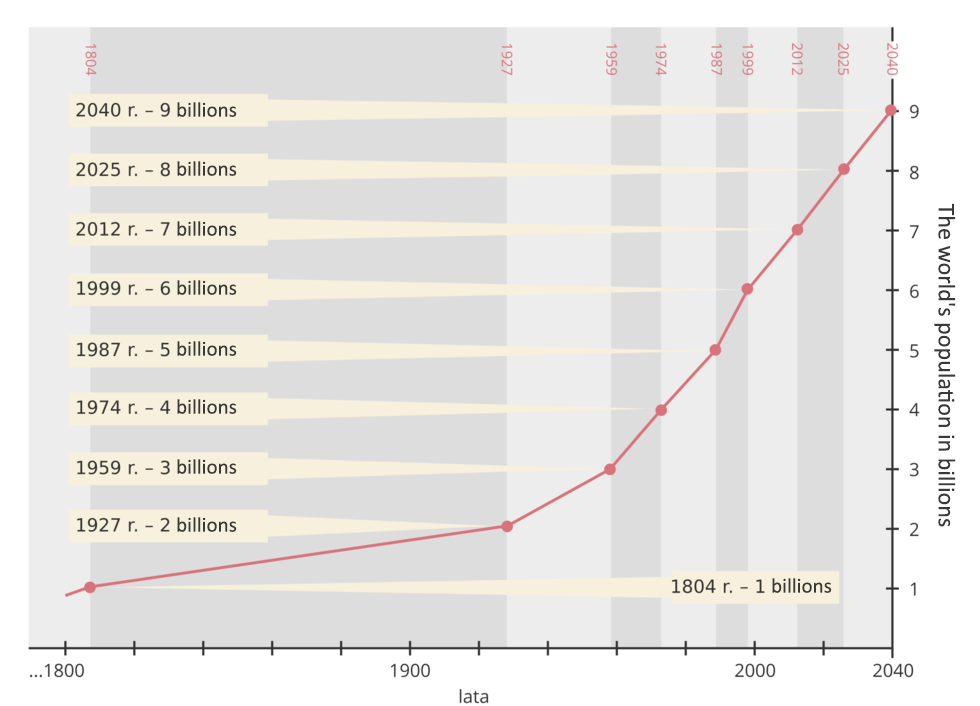
The graph clearly shows that the population was increasing rather slowly throughout the millennia. It means that the rate of natural increaserate of natural increase was incredibly low. It went up in the modern times, and sharply sped up in the 19th century. Nowadays, the change pace is still high, but it slightly lost its initial speed.
The main problem of people was the lack of food, since they were dependent solely on the natural environment. Because of malnutrition, people were more prone to get sick. As the causes of the diseases were unknown, both the preventive treatment and the regular treatment were limited. The situation resulted in high mortality rate. In order to overcome this problem, more kids were born. People knew that a significant amount of them would die before they reached the adult age.
The big change, also on the demographic level, was brought by the 19th century Industrial Revolution.
Understanding plant physiology gave rise to fertilizers and increased food production. Due to the development of microbiology, the causes of diseases were identified and methods of food storage were discovered. The population moving to the cities gained in the industry, independent of the weather and the season of the year, source of income, and housing conditions, though disastrous from our point of view, were better than in most villages.
These factors have contributed to the reduction of mortality with still high level of births. The result of such a situation was a sharp increase in population growth and population.
There was a decrease in the birth rate, but also a steady, low mortality rate. People noticed that the progress in various areas of life positively influenced the mortality rate. Parents became less dependent on their kids, because of pension schemes and social security system. It influenced indirectly the decrease in the population growth, this time because of the low birth rate and even lower mortality rate.
Stages of demographic transition
Thanks to the long‑time data analysis of the rate of natural increase in a given country, it was possible to create a so‑called demographic transition model.
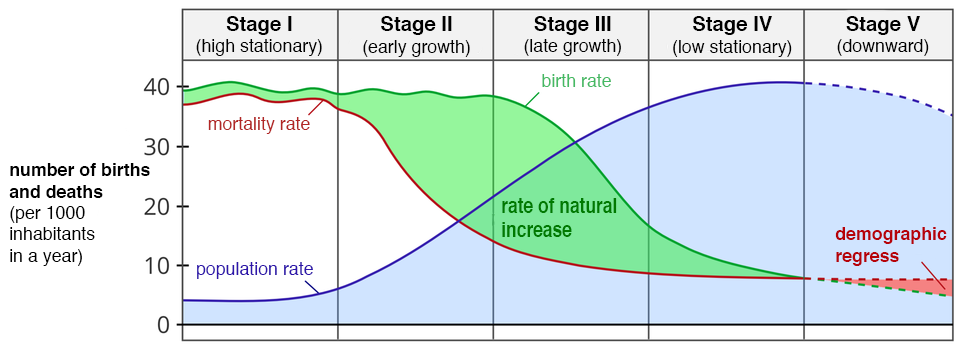
In Stage One, the rate of natural increase is very low, sometimes even negative (population decline), because the high birth rate is balanced by just as high mortality rate. Often the number of children determines the position of the family in the community. In this stage, only a few communities remained in the most remote parts of the equatorial forests of South America or New Guinea.
In Stage Two, the rate of natural increase is high; therefore, it can be often described with a term population explosionpopulation explosion. It is the result of a decrease in mortality while maintaining a high level of births. The number of deaths has decreased due to increased food production, the introduction of health education and vaccines. The largest number of such societies is in sub‑Saharan Africa.
In Stage Three, the mortality rate keeps decreasing, however, at slower rate than before. The most significant difference in this stage is decrease in the birth rate resulting from, among other things, educating girls and women. The achievement of even basic education by women contributes to the birth of the first child at a later age. In addition, educated women can look after their offspring better, which in turn results in longer intervals between births. In this stage, there are some societies in developing countries, such as Brazil and Thailand.
In Stage Four, the rate of natural increase is low because of low mortality and fertility rates. This stage is common for the most developed countries, in which the pension system make the parents less dependent on their kids. Also, since people tend to be more focused on their career, they start a family later in time. Knowledge of human physiology, common knowledge about family planning, and an attitude towards satisfying one's own needs are additional factors that cause the first child to appear quite late, and the subsequent ones are less.
The Stage Five, was added to the model later on, because it turned out that many European countries have a long‑term negative rate of natural increase. Germany is in the worst situation in Europe. This phenomenon also exists in post‑Communist countries.
The demographic transition model is accompanied by the epidemiological transition model – it describes the changes in the death causes in each stage of population developing.
The first stage is dominated by malnutrition, hunger, injuries, infectious and parasitic diseases. The second stage is characterized by the prevalence of infectious diseases that easily attack large human populations and parasitic occurrences occurring especially in hot and humid areas. In subsequent stages, civilization diseases become more and more important: circulatory system, diabetes, cancer and degenerative diseases, such as Alzheimer's disease or parkinsonism.
Analyse the problem with a metaplane.
Significance of demographic structure
The proportion between the young and the older part of a society can differ drastically from country to country. The data sample is showed below.
Age groups in % | |||||
Country | 0–14 | 15–24 | 25–54 | 55–64 | over 65 |
Niger | 49.8 | 18.4 | 25.9 | 2.6 | 2.6 |
India | 28.5 | 18.1 | 40.6 | 5.8 | 5.7 |
Brazil | 23.8 | 16.5 | 43.7 | 7.6 | 7.3 |
Spain | 15.4 | 9.6 | 45.9 | 17.6 | 17.5 |
Germany | 13.0 | 10.6 | 41.7 | 21.1 | 20.9 |
Japan | 13.2 | 9.7 | 38.1 | 25.8 | 24.6 |
The most comfortable way to analyse the demographic structure is by looking at this peculiar type of chart – the age pyramidage pyramid.
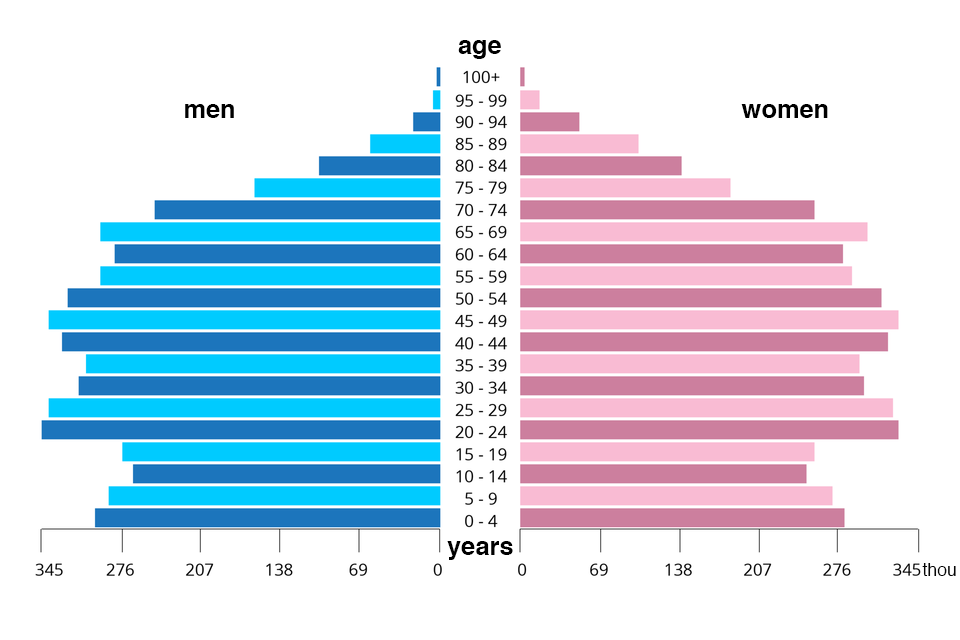
Having a lot of kids means that the parents need to: feed them accordingly to their physiology, provide them with medical care (for example, vaccinate them), and provide them with appropriate housing conditions. Another challenge is education – there is a need for schools, well‑formed teachers and, at least, basic teaching aids. It can be very costly for the budget of many countries.
Match the country with the corresponding demographic stage and its characteristics.
|
Stage One
|
Niger, Ethiopia
|
Low rate of natural increase caused by low mortality and fertility rates. Typical for the most developed countries, in which the pension system makes the parents less dependent on their kids. Also, since people tend to be more focused on their career, they start a family later in time. The average life expectancy is over 70 years.
|
|
Stage Two
|
Australia, Canada
|
Cyclical increase in morbidity and death rate because of the epidemics or hunger. The most common are parasitic diseases, like malaria, and contagious diseases, like cholera. The population decline is often a case here. The average life expectancy is 20-30 years.
|
|
Stage Three
|
Germany, Japan, Poland, Russia
|
Decrease in the birth rate caused by, among others, education of girls and women. In some countries, the decrease in birth rate can also be caused by the government politics. The average life expectancy is 50-70 years.
|
|
Stage Four
|
New Guinea
|
The long-term negative rate of natural increase. This phenomenon also exists in post-Communist countries. In some countries, the birth rate is close to or could be even lower than the mortality rate. There is a population decline, a so-called 'economic recession'.
|
|
Stage Five
|
Brazil, China, India
|
High rate of natural increase, often described with a term 'population explosion'. It is the result of decrease in mortality rate while keeping the birth rate high. The number of deaths went down thanks to thriving food production, introduction of health education and vaccines. The average life expectancy is 30-50 years.
|
Summary
There are serious and long‑term challenges when it comes to finance and organisation challenges for both young and aging populations.
In some countries, the governments introduce certain measures to increase the rate of natural increase.
Keywords
population explosion, stages of demographic transition, age pyramid
Match the pairs: English words with Polish definition.
the difference between the inflow (immigration) and the outflow (emigration) of the population from a given area at a given time., określenie szybkiego tempa przyrostu rzeczywistego liczby ludności w danym regionie. Przyjmuje się, że o eksplozji demograficznej możemy mówić, gdy przyrost rzeczywisty przekracza 3%, oznacza to podwojenie liczby ludności w ciągu 24 lat, czyli w ciągu jednej generacji., dwa diagramy słupkowe zestawione obok siebie, utworzone dla poszczególnych roczników lub grup wiekowych, pokazujące strukturę wieku kobiet oraz mężczyzn zamieszkałych na danym obszarze, liczba urodzonych dzieci przypadających na jedną kobietę w wieku rozrodczym (15‑49 lat), różnica między liczbą urodzeń a liczbą zgonów na danym obszarze (w państwie, województwie itp.) w określonym czasie, najczęściej w ciągu roku, zmiana liczby ludności na danym obszarze w określonym czasie; przyrost rzeczywisty to suma przyrostu naturalnego i salda migracji
| age pyramid | |
| fertility rate | |
| population explosion | |
| rate of natural increase (RNI) | |
| total population growth | |
| balance of migration |
Glossary
piramida wieku – dwa diagramy słupkowe zestawione obok siebie, utworzone dla poszczególnych roczników lub grup wiekowych, pokazujące strukturę wieku kobiet oraz mężczyzn zamieszkałych na danym obszarze
współczynnik dzietności – liczba urodzonych dzieci przypadających na jedną kobietę w wieku rozrodczym (15‑49 lat)
eksplozja demograficzna – określenie szybkiego tempa przyrostu rzeczywistego liczby ludności w danym regionie. Przyjmuje się, że o eksplozji demograficznej możemy mówić, gdy przyrost rzeczywisty przekracza 3%, oznacza to podwojenie liczby ludności w ciągu 24 lat, czyli w ciągu jednej generacji.
przyrost naturalny (ruch naturalny) – różnica między liczbą urodzeń a liczbą zgonów na danym obszarze (w państwie, województwie itp.) w określonym czasie, najczęściej w ciągu roku
przyrost rzeczywisty – zmiana liczby ludności na danym obszarze w określonym czasie; przyrost rzeczywisty to suma przyrostu naturalnego i salda migracji
saldo migracyjne – the difference between the inflow (immigration) and the outflow (emigration) of the population from a given area at a given time.