You will learn to present and interpret statistical data obtained from various sources.
Learning effect
You read and interpret statistical data presented in the form of a table, a bar chart or a pie chart.
Analyse the example:
Example 1
A survey was conducted among students of the eighth grade, whether or not they liked the last set book they were discussing in the class. Students could answer: yes, no, I don’t know. Obtained results were presented in the tabletabletable.
See how we can present data from the table using a bar chart.
R12YNMAkGgMas
Ilustracja interaktywna przedstawia diagram słupkowy. Oś pionowa opisana number of answers, zaznaczono na niej 0, 20, 40, 60, 80, 100. Oś pozioma opisana possible answers, narysowane trzy słupki oznaczone numerami: 1 - wysokość 90, 2 - wysokość 45, 3 - wysokość 15. Na numerach widoczne są podpisy. 1. yes {audio}, 2. no {audio}, 3. I don’t know {audio}.
Ilustracja interaktywna przedstawia diagram słupkowy. Oś pionowa opisana number of answers, zaznaczono na niej 0, 20, 40, 60, 80, 100. Oś pozioma opisana possible answers, narysowane trzy słupki oznaczone numerami: 1 - wysokość 90, 2 - wysokość 45, 3 - wysokość 15. Na numerach widoczne są podpisy. 1. yes {audio}, 2. no {audio}, 3. I don’t know {audio}.
A bar chart
Source: GroMar, licencja: CC BY 3.0.
Look for important information about applied forms of presenting statistical datastatistical datastatistical data on the Internet.
Conclusions:
The most common form of presenting statistical datastatistical datastatistical data is a tabletabletable.
Graphical presentation of statistical datastatistical datastatistical data is making various types of graphs.
A graph is made of the title, the area of a graph, a legend, that contains information about applied symbols, colours and source of data.
In a certain school there was a contest for the class that reads the most books in the current schoolyear. Classes 6, 7 and 8 took part in the competition. After finishing the contest, organizers prepared results in the form of a tabletabletable and presented the winners.
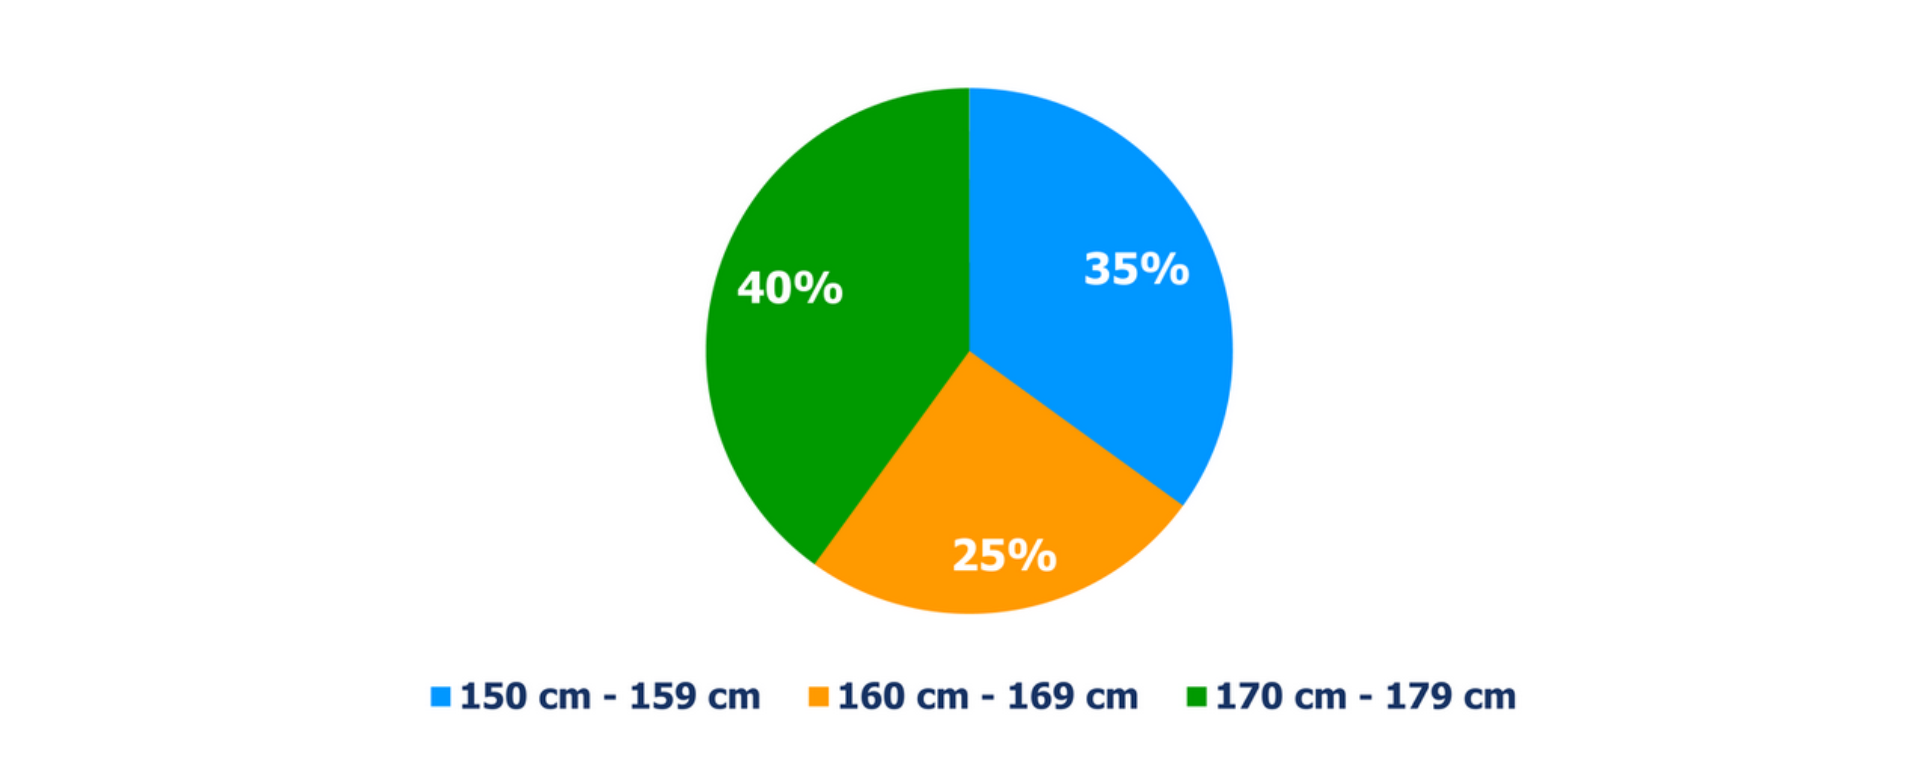
Data about height of students in the class was presented on a pie chartpie chartpie chart.
Knowing that there are 20 people in the class, draw a bar chart for this data.
R1HtaATVpGMB41
Ilustracja przedstawia diagram kołowy podzielony na trzy części: 40 procent odpowiada 170 cm do 179 cm, 35 procent odpowiada 160 cm do 169 cm, 25 procent odpowiada 150 cm do 159 cm.
Make a questionnaire in your class about eye colour. Present data in the form of a pie chartpie chartpie chart.
Do the revision exercises.
Exercises
Exercise 1
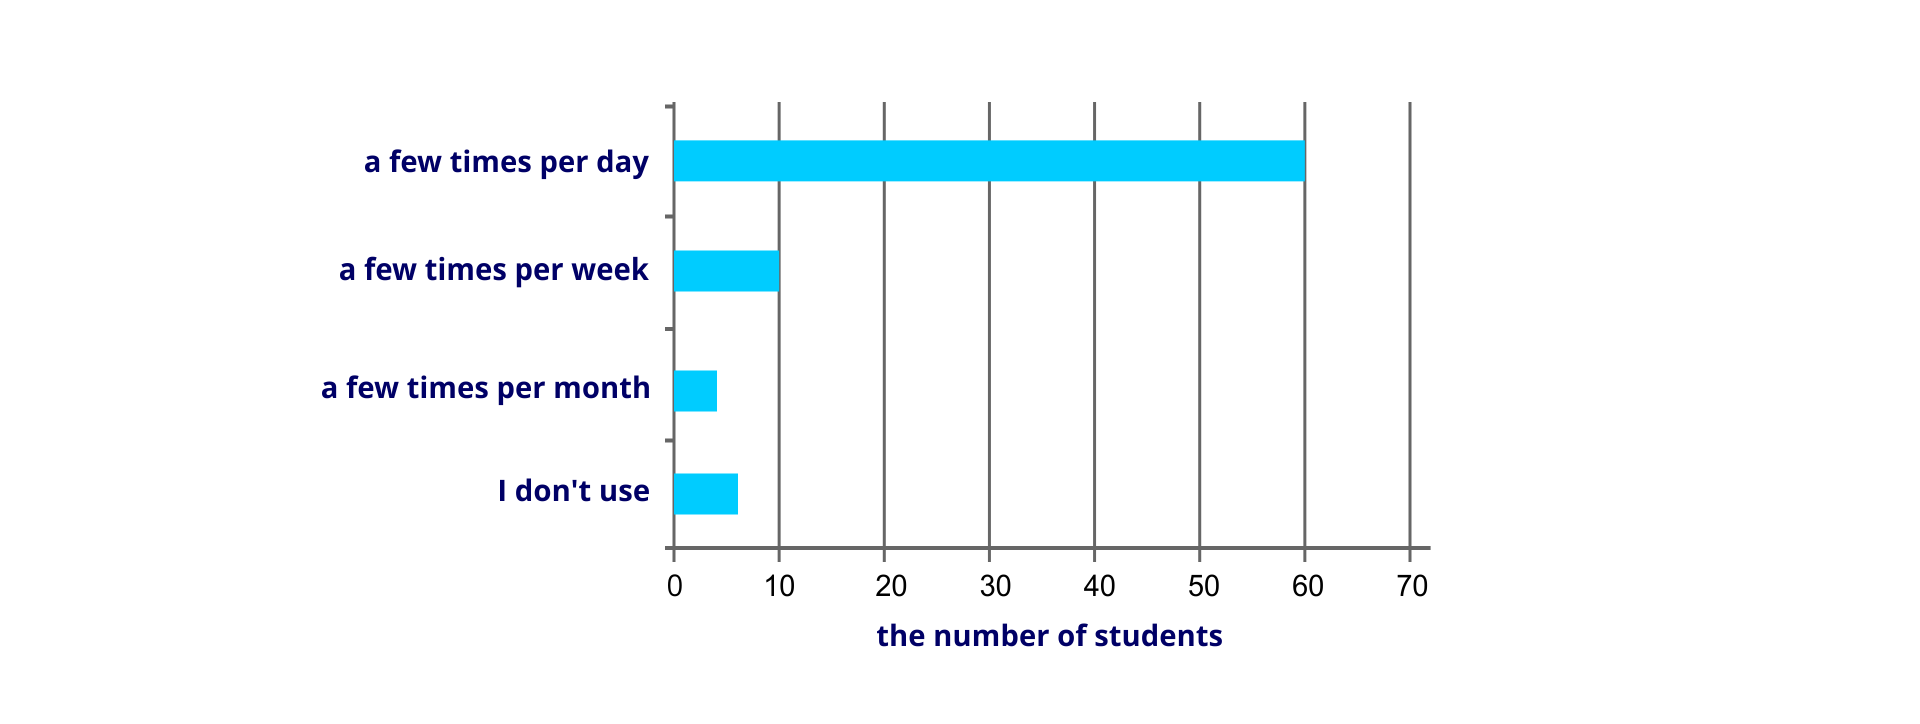
In the horizontal pie chart there are results of a questionnaire done among students. The question was ‘How often do you use the Internet?’
R1FawzKXzR0Qv1
Ilustracja przedstawia poziomy diagram słupkowy. Oś pozioma opisana the number of students, zaznaczono na niej 0, 10, 20, 30, 40, 50, 60, 70. Na osi pionowej słupki: a few times per day - długość 60, a few times per week - długość 10, a few times per month - długość 5, I don’t use - długość 7.
Source: GroMar, licencja: CC BY 3.0.
RCmzZLKAsYvuj
Wersja alternatywna ćwiczenia: How many students took part in the questionnaire? Możliwe odpowiedzi: 1. 60, 2. 80, 3. 4, 4. 6
Wersja alternatywna ćwiczenia: How many students took part in the questionnaire? Możliwe odpowiedzi: 1. 60, 2. 80, 3. 4, 4. 6
How many students took part in the questionnaire?
60
80
4
6
zadanie
Source: GroMar, licencja: CC BY 3.0.
Exercise 2
Create a line graph using data about the change of temperature in the place you live for a period of a week. Make the measurements always at the same hour.
Student's individual work.
Exercise 3
Look for information about the latest presidential election in Poland on the internet. Present results of each candidate using a percentage diagram. Describe the solution in English.
R1VDjDI0mV7B7
Exercise 4
Wersja alternatywna ćwiczenia: Match Polish terms with their English equivalents. dane statystyczne Możliwe odpowiedzi: 1. vertical bar chart, 2. pie chart, 3. percentage diagrams, 4. table, 5. statistical data diagram kołowy Możliwe odpowiedzi: 1. vertical bar chart, 2. pie chart, 3. percentage diagrams, 4. table, 5. statistical data diagram słupkowy pionowy Możliwe odpowiedzi: 1. vertical bar chart, 2. pie chart, 3. percentage diagrams, 4. table, 5. statistical data diagramy procentowe Możliwe odpowiedzi: 1. vertical bar chart, 2. pie chart, 3. percentage diagrams, 4. table, 5. statistical data tabela Możliwe odpowiedzi: 1. vertical bar chart, 2. pie chart, 3. percentage diagrams, 4. table, 5. statistical data
Wersja alternatywna ćwiczenia: Match Polish terms with their English equivalents. dane statystyczne Możliwe odpowiedzi: 1. vertical bar chart, 2. pie chart, 3. percentage diagrams, 4. table, 5. statistical data diagram kołowy Możliwe odpowiedzi: 1. vertical bar chart, 2. pie chart, 3. percentage diagrams, 4. table, 5. statistical data diagram słupkowy pionowy Możliwe odpowiedzi: 1. vertical bar chart, 2. pie chart, 3. percentage diagrams, 4. table, 5. statistical data diagramy procentowe Możliwe odpowiedzi: 1. vertical bar chart, 2. pie chart, 3. percentage diagrams, 4. table, 5. statistical data tabela Możliwe odpowiedzi: 1. vertical bar chart, 2. pie chart, 3. percentage diagrams, 4. table, 5. statistical data
Match Polish terms with their English equivalents.
percentage diagrams, vertical bar chart, pie chart, table, statistical data
dane statystyczne
diagram kołowy
diagram słupkowy pionowy
diagramy procentowe
tabela
R1LPsNVjpTZo11
Interaktywna gra, polegająca na łączeniu wyrazów w pary w ciągu jednej minuty. Czas zaczyna upływać wraz z rozpoczęciem gry. Jeden ruch to odkrywanie najpierw jednej potem drugiej karty z wyrazem. Każdy wyraz jest odczytywany. Kolejny ruch to odkrywanie trzeciej i czwartej karty. W ten sposób odsłuchasz wszystkie wyrazy. Nawigacja z poziomu klawiatury za pomocą strzałek, odsłuchiwanie wyrazów enterem lub spacją. Znajdź wszystkie pary wyrazów.
Interaktywna gra, polegająca na łączeniu wyrazów w pary w ciągu jednej minuty. Czas zaczyna upływać wraz z rozpoczęciem gry. Jeden ruch to odkrywanie najpierw jednej potem drugiej karty z wyrazem. Każdy wyraz jest odczytywany. Kolejny ruch to odkrywanie trzeciej i czwartej karty. W ten sposób odsłuchasz wszystkie wyrazy. Nawigacja z poziomu klawiatury za pomocą strzałek, odsłuchiwanie wyrazów enterem lub spacją. Znajdź wszystkie pary wyrazów.
Match Polish terms with their English equivalents.
diagram słupkowy poziomy
vertical bar chart
statistical data
diagram kołowy
horizontal bar chart
diagram słupkowy pionowy
dane statystyczne
tabela
table
pie chart
Source: Zespół autorski Politechniki Łódzkiej, licencja: CC BY 3.0.