On the basis of the information presented in the tabletabletable the students answer the following questions: a) Which continent has the largest area? b) Which continent has the smallest area? c) By how many more thousand kmIndeks górny 22 is Antarctica bigger than Europe? d) By how many more thousand kmIndeks górny 22 is Africa larger than South America? e) Which continents have areas larger than the area of Europe?
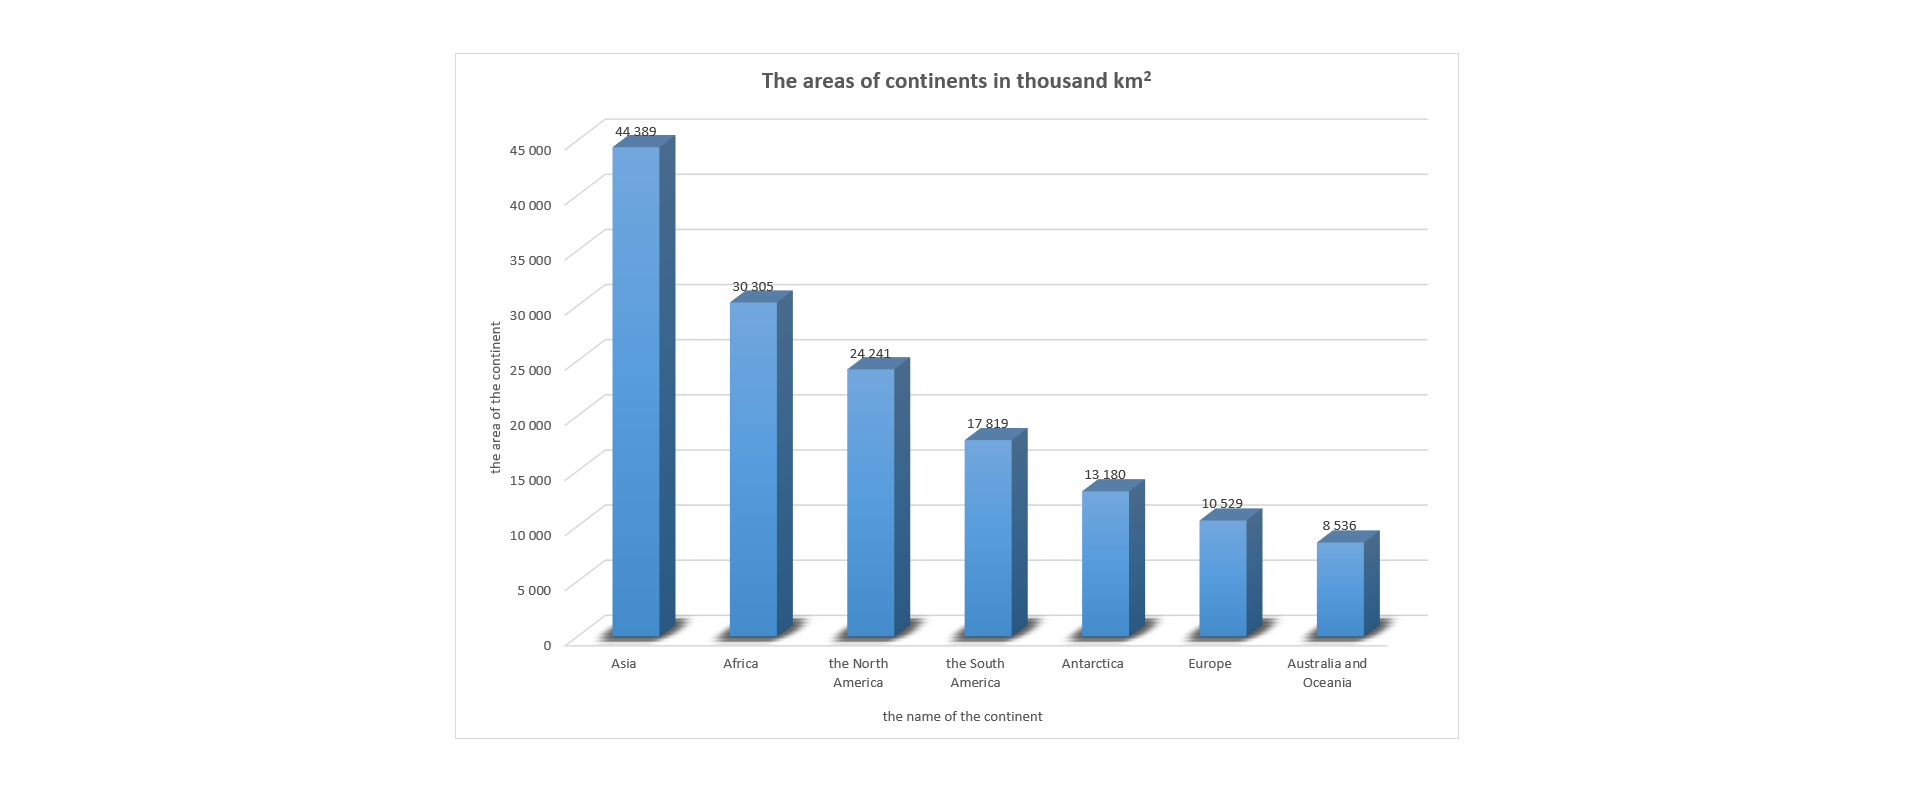
The even‑numbered groups use their computers to watch the vertical bar diagrambar diagrambar diagram presenting the data from the table presenting the areas of continents.
R1bsl80iOXruz1
Rysunek przedstawia diagram słupkowy: The areas of continents in thousand square km. Na osi pionowej opisanej: the area of the continent, skala od 0 do 45000, co 5000. Na osi poziomej opisanej: the name of the continent, od lewej: Asia - słupek wysokości 44389, Africa - słupek wysokości 30305, the North America - słupek wysokości 24241, the South America - słupek wysokości 17819, Antarctica - słupek wysokości 13180, Europe - słupek wysokości 10529, Australia and Oceania - słupek wysokości 8536.
Use your computer to watch the percentage horizontal bar diagrambar diagrambar diagram presenting the data from the table presenting the areas of continents.
R1KPXgBeI6Xgx
Ilustracja interaktywna przedstawia diagram słupkowy poziomy: The area of continents %. Oś pozioma opisana: the area of the continent, skala 0,00 procent do 30,00 procent co 5 procent. Oś pionowa opisana: the name of the continents, od góry: Australia and Oceania - słupek długości 5,70 procent, Europe - słupek długości 7,10 procent, Antarctica - słupek długości 8,80 procent, The South America - słupek długości 12,00 procent, The Norht America - słupek długości 16,30 procent, Africa - słupek długości 20,30 procent, Asia - słupek długości 29,80 procent. Na ilustracji widoczne są numery, a na nich podpisy. 1. 5,70% {audio}, 2. 7,10% {audio}, 3. 8,80% {audio}, 4. 12% {audio}, 5. 16,30% {audio}, 6. 20,30% {audio}, 7. 29,80% {audio}.
Ilustracja interaktywna przedstawia diagram słupkowy poziomy: The area of continents %. Oś pozioma opisana: the area of the continent, skala 0,00 procent do 30,00 procent co 5 procent. Oś pionowa opisana: the name of the continents, od góry: Australia and Oceania - słupek długości 5,70 procent, Europe - słupek długości 7,10 procent, Antarctica - słupek długości 8,80 procent, The South America - słupek długości 12,00 procent, The Norht America - słupek długości 16,30 procent, Africa - słupek długości 20,30 procent, Asia - słupek długości 29,80 procent. Na ilustracji widoczne są numery, a na nich podpisy. 1. 5,70% {audio}, 2. 7,10% {audio}, 3. 8,80% {audio}, 4. 12% {audio}, 5. 16,30% {audio}, 6. 20,30% {audio}, 7. 29,80% {audio}.
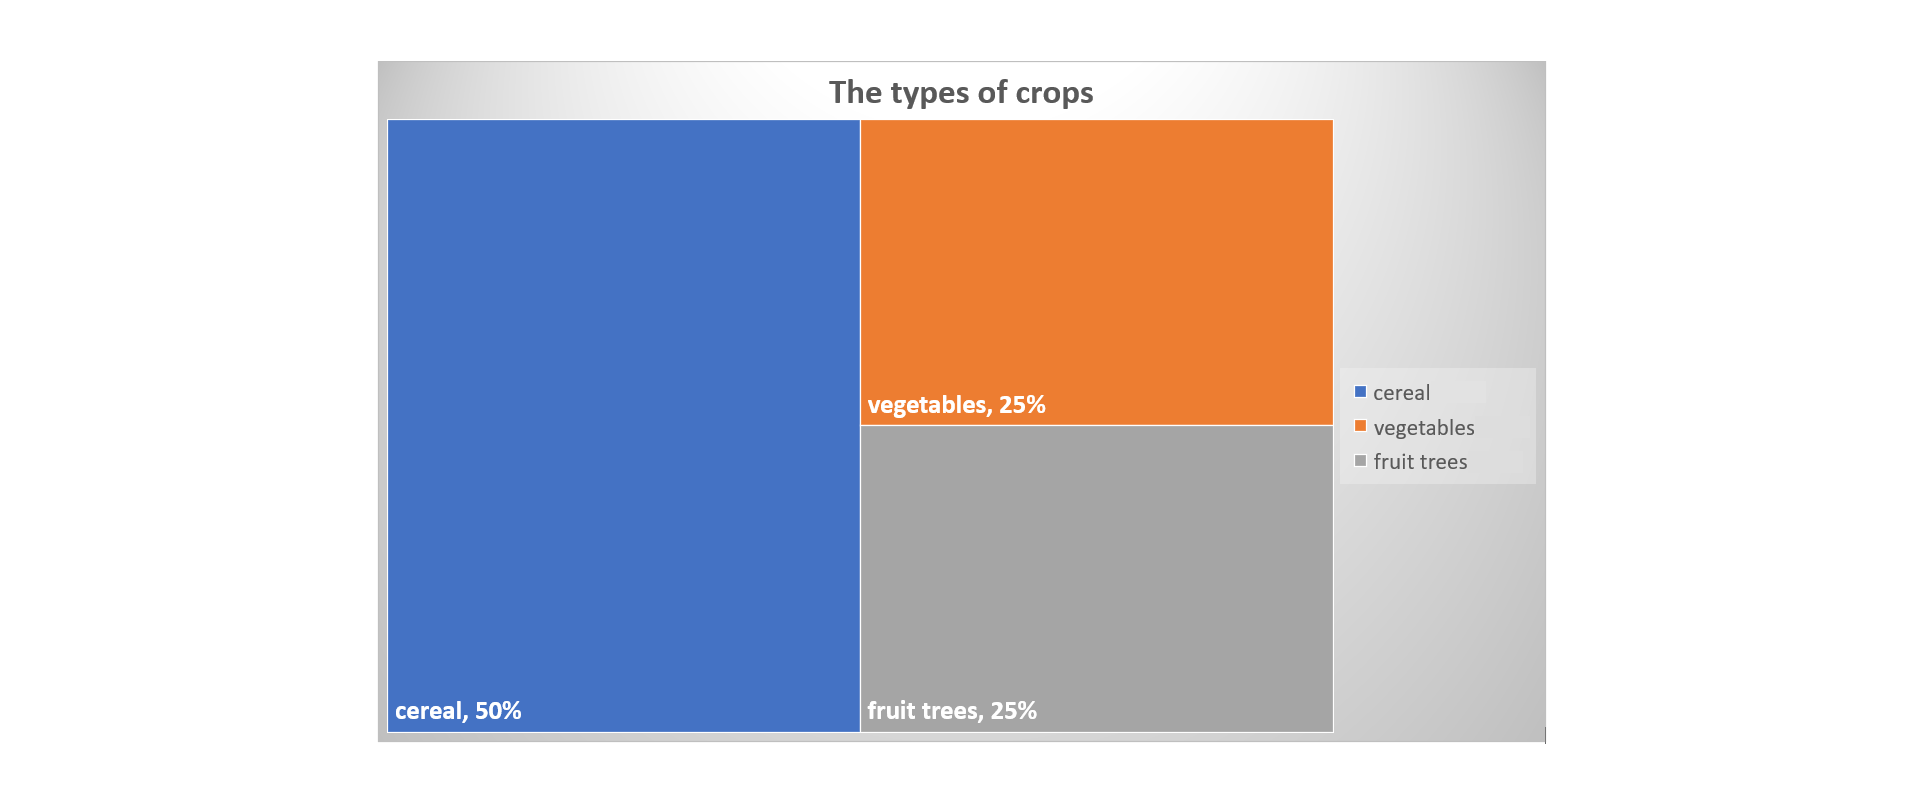
Draw the square, the rectangular diagramrectangular diagramrectangular diagram and the pie chartpie chartpie chart.
The farmer said that the 50% of his crops was occupied by the cereals, 25% was used for vegetables and on the rest of the field the fruit trees grew. What part of the crops are the fruit trees?
Sample groups diagrams.
RnP6Xu3HgQsiu1
Rysunek przedstawia diagram kwadratowy: The types of crops. Prostokąt po lewej - cereal, 50%, prostokąt na górze po prawej - vegetables, 25%, prostokąt na dole po prawej - fruit trees, 25%. Po prawej stronie wykresu legenda.
Source: GroMar, licencja: CC BY 3.0.
R1WJuBpILKI7Q1
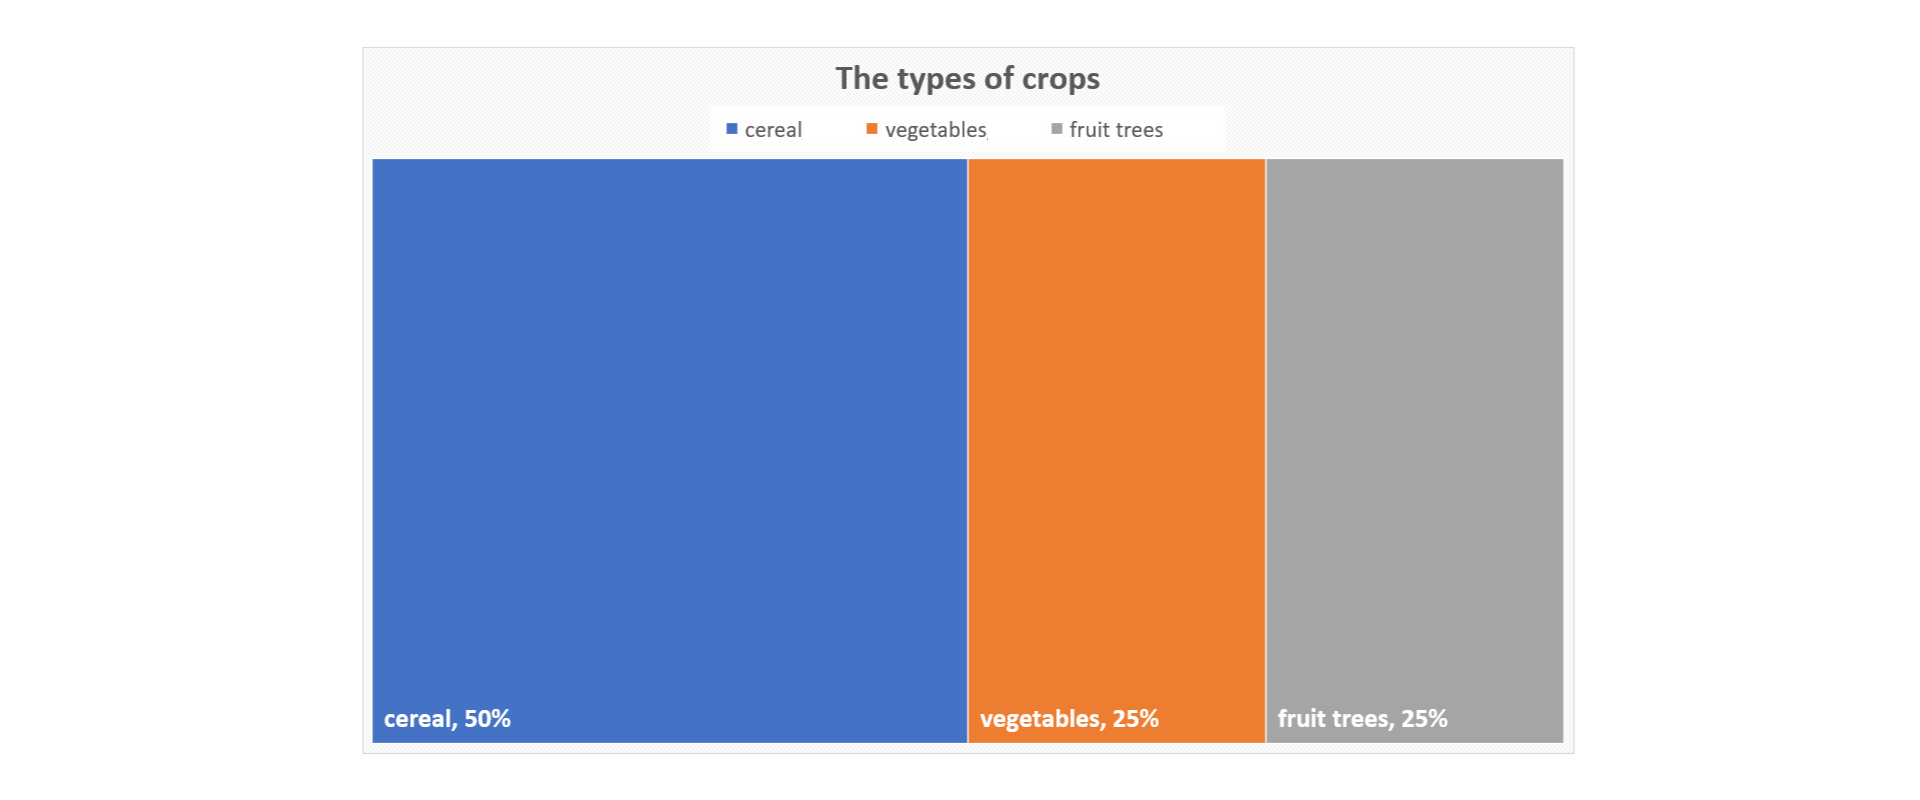
Rysunek przedstawia diagram prostokątny: The types of crops. Prostokąty od lewej: cereal, 50%; vegetables, 25%; fruit trees, 25%. Pod tytułem legenda.
Source: GroMar, licencja: CC BY 3.0.
R1PMwtC8QrB1a1
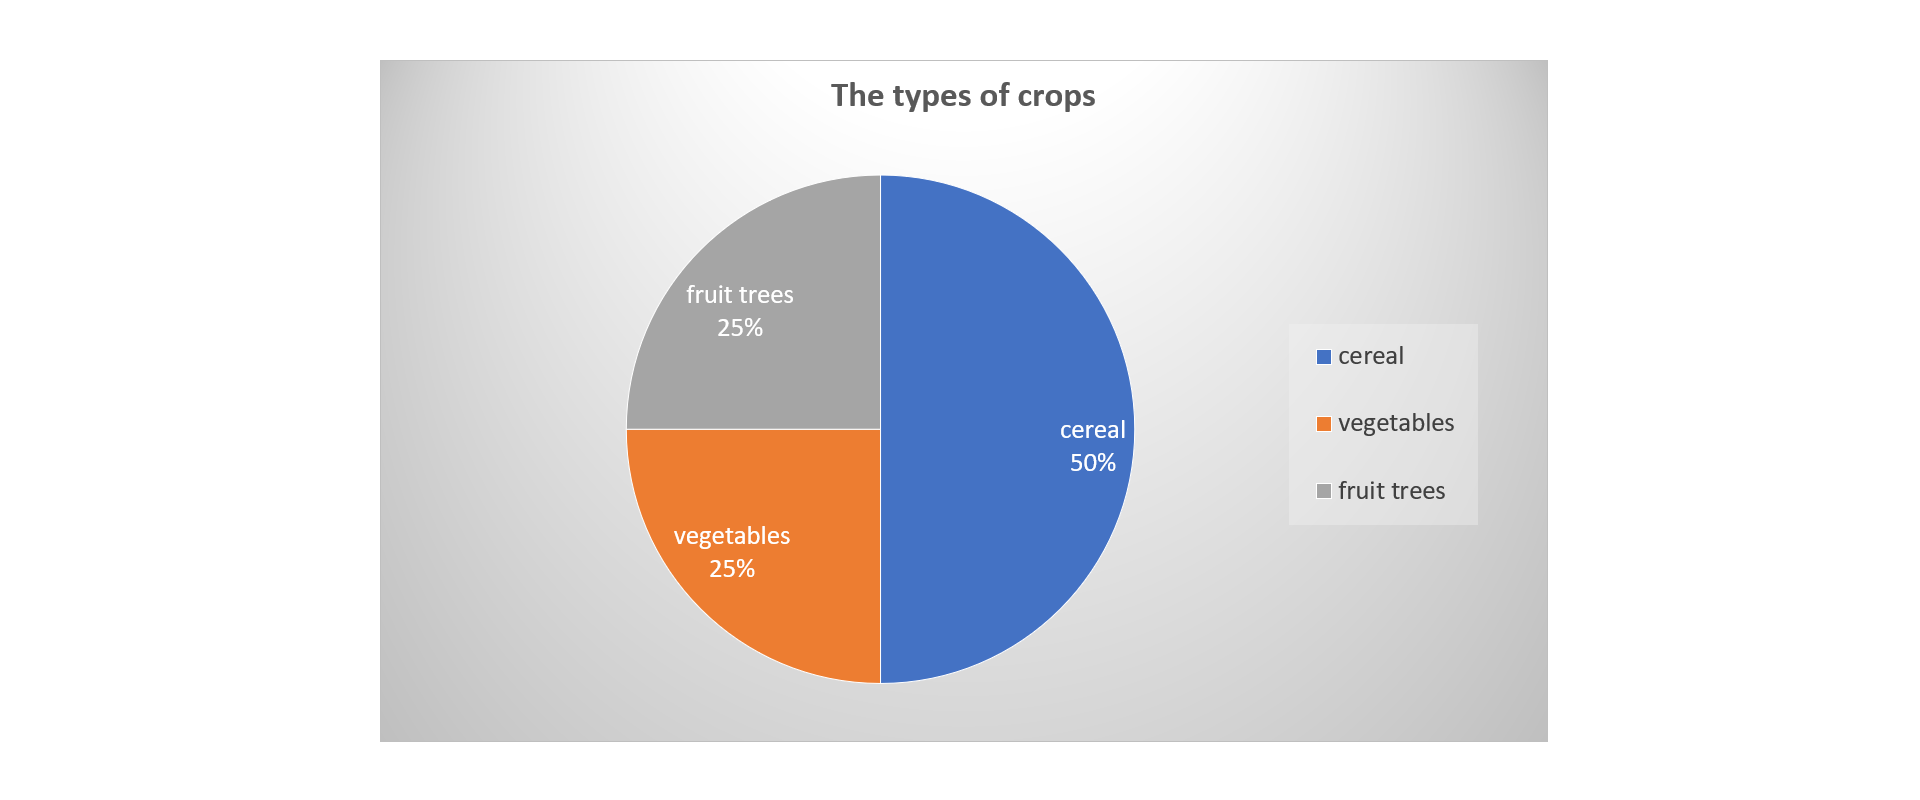
Rysunek przedstawia diagram kołowy: The types of crops. Półkole po prawej - cereal, 50%; ćwiartka koła na górze po lewej - fruit trees, 25%; ćwiartka koła na dole po lewej - vegetables, 25%; . Po prawej stronie wykresu legenda.
Source: GroMar, licencja: CC BY 3.0.
Conclusion:
Each diagramdiagramdiagram presents the same information.
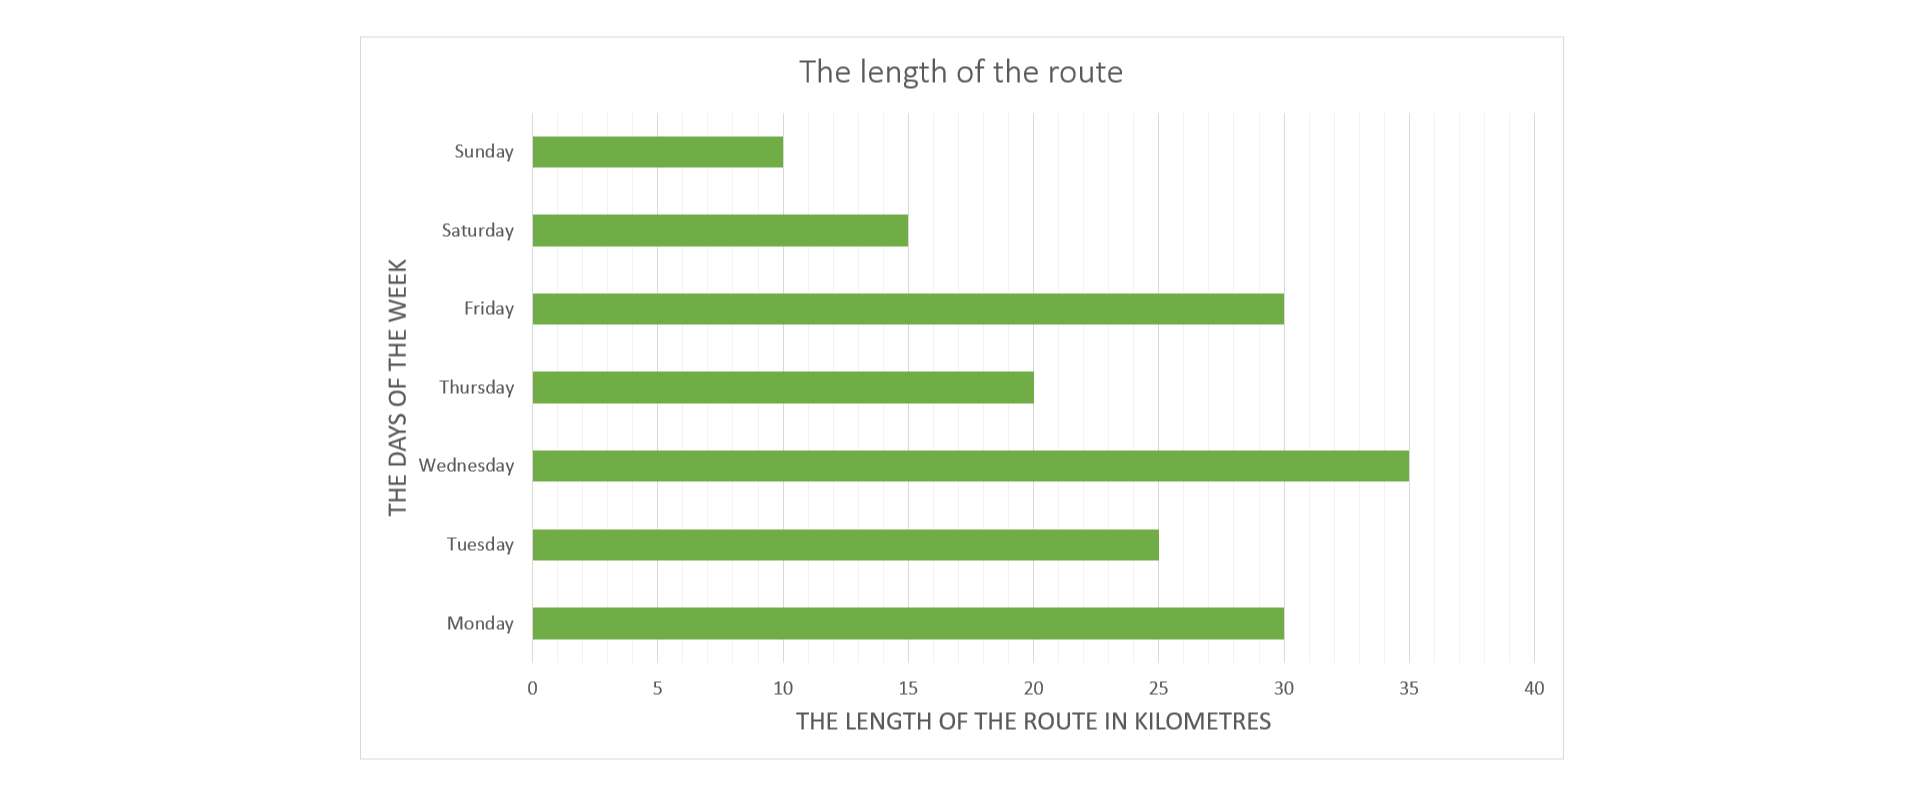
The students read and interpret the information presented in the horizontal bar diagrambar diagrambar diagram.
The scouts went for a one‑week bike trip.
The diagramdiagramdiagram shows the following stages of the trip.
R1HSD8vOnZRR41
Rysunek przedstawia diagram słupkowy poziomy: The length of the route. Oś pozioma opisana: The length of the route in kilometres, skala od 0 do 40, co 5. Oś pionowa opisana: The days of the week, od dołu: Monday - słupek długości 30, Tuesday - słupek długości 25, Wednesday - słupek długości 35, Thursday - słupek długości 20, Friday - słupek długości 30, Saturday - słupek długości 15, Sunday - słupek długości 10.
Answer the following questions: a) On which day did the scouts cover the shortest distance? b) On which days did they make the same number of kilometres? c) On which day did the scouts cover the longest route? d) How many kilometres did the scouts make on Sunday? e) How many more kilometres did they make on Wednesday in comparison to Saturday?
Task 4
An extra task:
Find on the Internet the current exchange rates of 5 currencies. On the basis of the information make the appropriate table.
Prepare an activity in which you use the tabletabletable you prepared.
Remember:
We can present the same data using the table and the diagramdiagramdiagram.
Check what you have learned by doing the following exercises.
Exercises
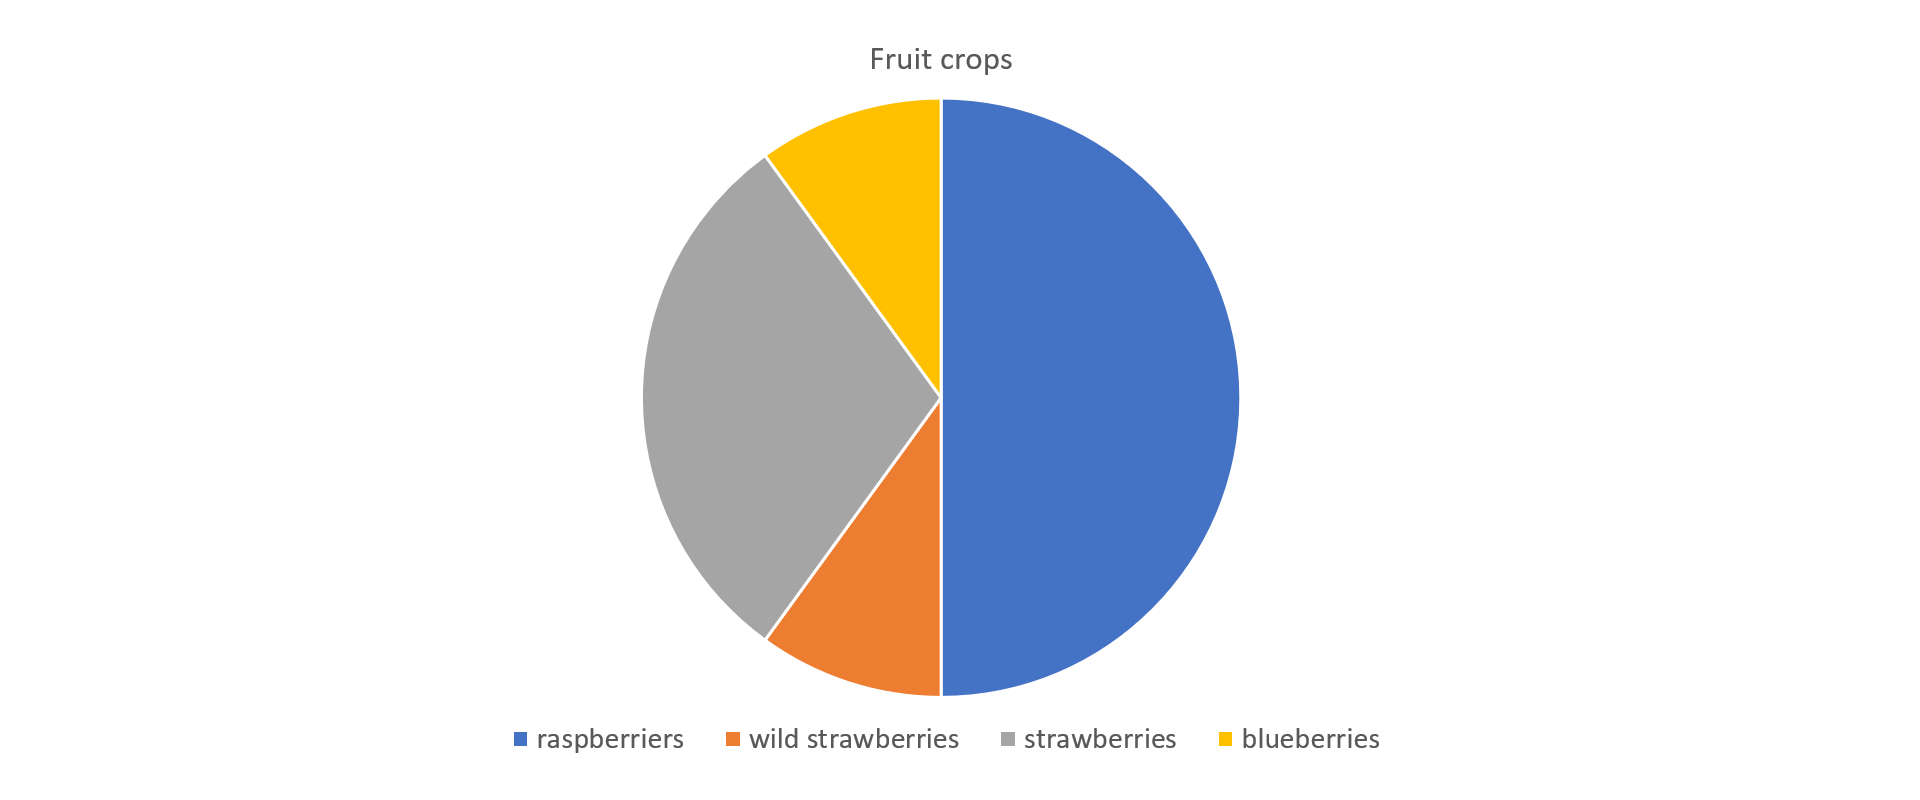
Exercise 1
RccfKcl2wQxBR1
Rysunek przedstawia diagram kołowy: Fruit crops. Raspberriers - 50 procent, wild strawberries - około 10 procent, strawberries - około 30 procent, blueberries - około 10 procent.
Source: GroMar, licencja: CC BY 3.0.
RQoqLOTLeU8bv
Wersja alternatywna ćwiczenia: Determine which sentences are true. Możliwe odpowiedzi: 1. Raspberries were the biggest harvest., 2. More blueberries than wild strawberries were harvested., 3. The blueberries were 50% of the total harvest., 4. There were more strawberries than blueberries and wild strawberries altogether., 5. The strawberries and blueberries are 40% of the total harvest., 6. There were twice as much strawberries than wild strawberries.
Wersja alternatywna ćwiczenia: Determine which sentences are true. Możliwe odpowiedzi: 1. Raspberries were the biggest harvest., 2. More blueberries than wild strawberries were harvested., 3. The blueberries were 50% of the total harvest., 4. There were more strawberries than blueberries and wild strawberries altogether., 5. The strawberries and blueberries are 40% of the total harvest., 6. There were twice as much strawberries than wild strawberries.
Determine which sentences are true.
Raspberries were the biggest harvest.
More blueberries than wild strawberries were harvested.
The blueberries were 50% of the total harvest.
There were more strawberries than blueberries and wild strawberries altogether.
The strawberries and blueberries are 40% of the total harvest.
There were twice as much strawberries than wild strawberries.
zadanie
Source: GroMar, licencja: CC BY 3.0.
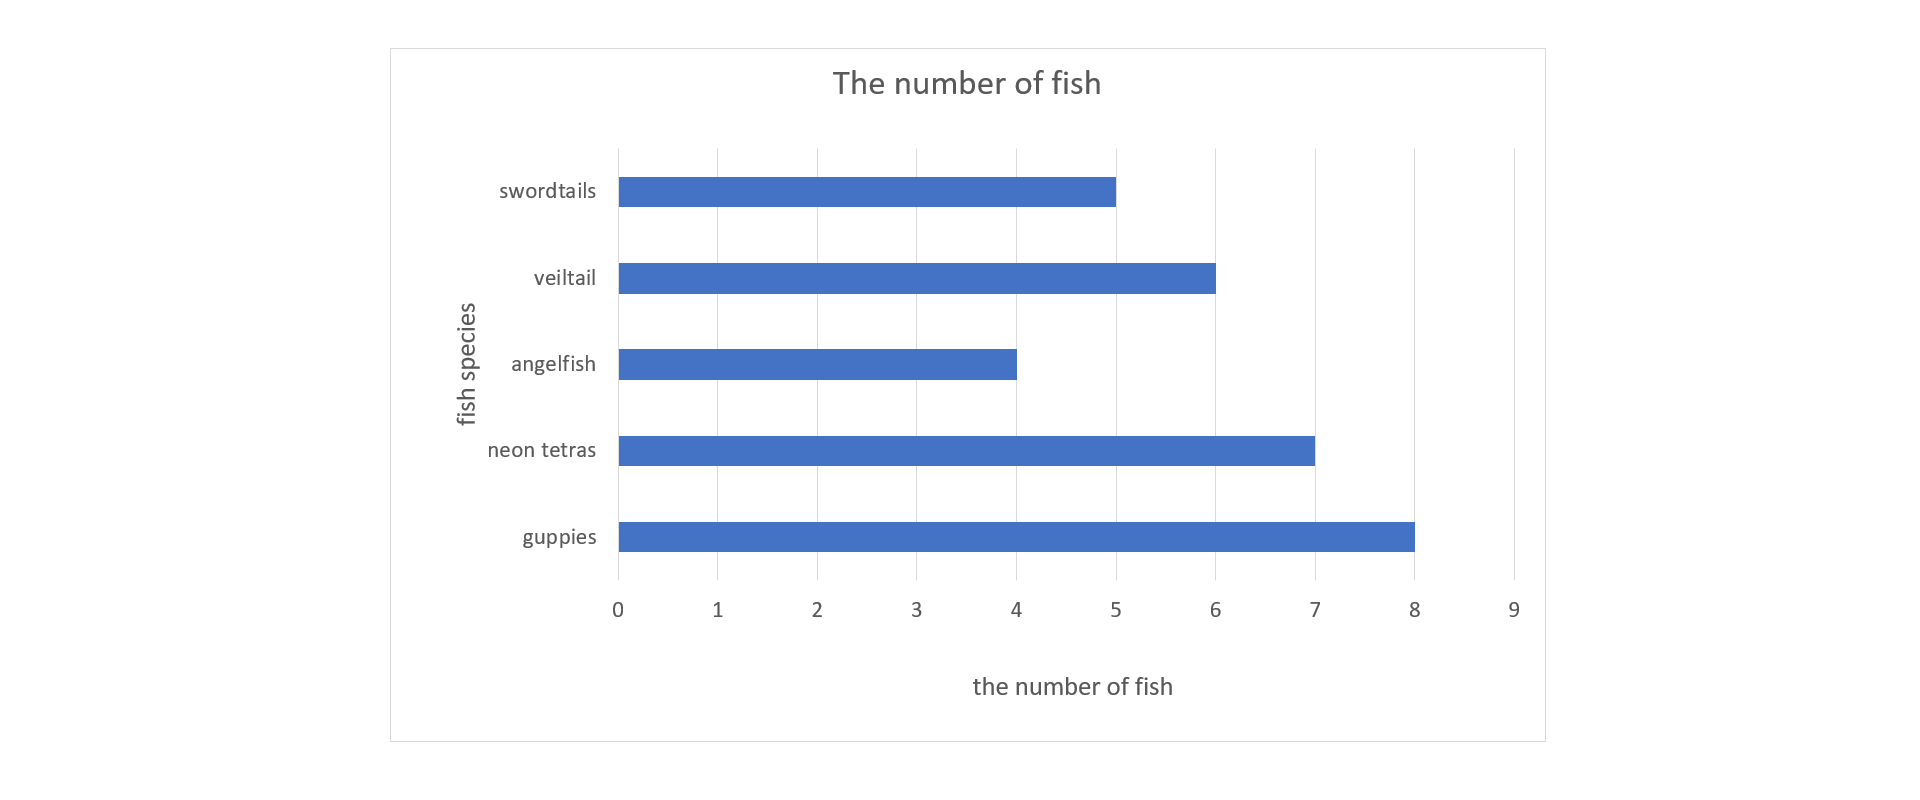
Exercise 2
Ala got an aquarium and fish for her birthday. She counted the number of fish of each species and presented the data using the diagram.
The title of the horizontal bar diagram: The number of fish
RHkvhKi0HLp1p1
Rysunek przedstawia diagram słupkowy poziomy: The number of fish. Oś pozioma opisana: the number of fish, skala od 0 do 9, co 1. Oś pionowa opisana: fish species, od dołu: guppies - słupek długości 8, neon tetras - słupek długości 7, angelfish - słupek długości 4, veitail - słupek długości 6, swordtails - słupek długości 5.
Source: GroMar, licencja: CC BY 3.0.
Answer the following questions:
a) What is the species of the largest number of Ala’s fish?
b) How many neon tetras has Ala got?
c) Has Ala got more swordtails or veiltails? How many more?
d) What is the species of the smallest number of Ala’s fish?
a) guppies
b) 7 neon tetras
c) veiltail, 1
d) angelfish
Exercise 3
The table presents the data pertaining to the depth of 10 Polish lakes.
The name of the lake
The maximum depth (m)
Śniardwy
23,4
Mamry
43,8
Łebsko
6,3
Dąbie
4,2
Miedwie
43,8
Jeziorak
12,9
Niegocin
39,7
Gardno
2,6
Jamno
3,9
Wigry
74,2
Answer the questions:
a) Which of the lakes is the deepest?
b) Which of the lakes is the most shallow?
c) By how many metres is the lake Wigry deeper than the lake Niegocin?
d) Which lakes have the same depth?
e) By how many metres is the lake Jeziorak more shallow than the lake Mamry?
a) Wigry
b) Gardno
c) 34,5 m
d) Mamry and Miedwie
e) 30,9 m
Exercise 4
RJz3lcTTM8uYg
Wersja alternatywna ćwiczenia: Indicate which pairs of expressions or words are translated correctly. Możliwe odpowiedzi: 1. diagram kwadratowy - square diagram, 2. diagram kołowy - pie chart, 3. diagram słupkowy - bar diagram, 4. tabela - table, 5. diagram prostokątny - diagram, 6. diagram - rectangular diagram
Wersja alternatywna ćwiczenia: Indicate which pairs of expressions or words are translated correctly. Możliwe odpowiedzi: 1. diagram kwadratowy - square diagram, 2. diagram kołowy - pie chart, 3. diagram słupkowy - bar diagram, 4. tabela - table, 5. diagram prostokątny - diagram, 6. diagram - rectangular diagram
Indicate which pairs of expressions or words are translated correctly.
diagram kwadratowy - square diagram
diagram kołowy - pie chart
diagram słupkowy - bar diagram
tabela - table
diagram prostokątny - diagram
diagram - rectangular diagram
zadanie
Source: GroMar, licencja: CC BY 3.0.
R1DU1wTfUPOW71
Interaktywna gra, polegająca na łączeniu wyrazów w pary w ciągu jednej minuty. Czas zaczyna upływać wraz z rozpoczęciem gry. Jeden ruch to odkrywanie najpierw jednej potem drugiej karty z wyrazem. Każdy wyraz jest odczytywany. Kolejny ruch to odkrywanie trzeciej i czwartej karty. W ten sposób odsłuchasz wszystkie wyrazy. Nawigacja z poziomu klawiatury za pomocą strzałek, odsłuchiwanie wyrazów enterem lub spacją. Znajdź wszystkie pary wyrazów.
Interaktywna gra, polegająca na łączeniu wyrazów w pary w ciągu jednej minuty. Czas zaczyna upływać wraz z rozpoczęciem gry. Jeden ruch to odkrywanie najpierw jednej potem drugiej karty z wyrazem. Każdy wyraz jest odczytywany. Kolejny ruch to odkrywanie trzeciej i czwartej karty. W ten sposób odsłuchasz wszystkie wyrazy. Nawigacja z poziomu klawiatury za pomocą strzałek, odsłuchiwanie wyrazów enterem lub spacją. Znajdź wszystkie pary wyrazów.
Match Polish terms with their English equivalents.
square diagram
diagram prostokątny
pie chart
diagram kołowy
diagram kwadratowy
diagram słupkowy
rectangular diagram
table
tabela
bar diagram
Source: Zespół autorski Politechniki Łódzkiej, licencja: CC BY 3.0.