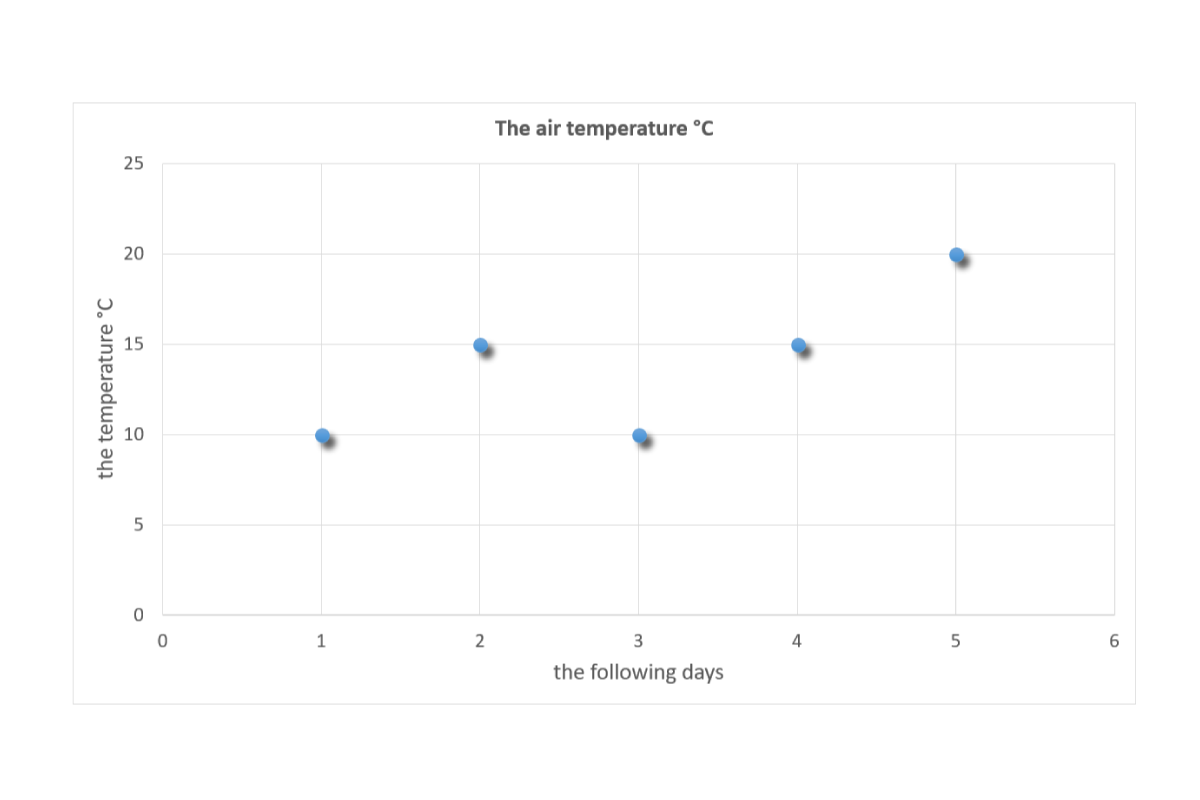
Analyse the data presented in the scatter plotscatter plotscatter plot. It shows the air temperature measured for five consecutive days.
RhRCs7uDwJbVv
Ilustracja interaktywna przedstawia temperaturę powietrza w stopniach Celsjusza mierzoną przez 5 kolejnych dni. Pomiar temperatury został przedstawiony w formie wykresu punktowego. Tytuł wykresu to: The air temperature degrees Celsius. Na osi x: the following days oraz wartości 1, 2 , 3, 4, 5, 6. Na osi y: the temperatura degrees Celsius oraz wartości 0, 5, 10, 15, 20, 25. Temperatura w poszczególnych dniach została oznaczona numerami od 1 do 5. Numer 1 - ma współrzędne na wykresie (1, 10). Numer 2 - ma współrzędne na wykresie (2, 15). Numer 3 - ma współrzędne na wykresie (3, 10). Numer 4 - ma współrzędne na wykresie (4, 15). Numer 5 - ma współrzędne na wykresie (5, 20). Na numerach widoczne są podpisy.
Ilustracja interaktywna przedstawia temperaturę powietrza w stopniach Celsjusza mierzoną przez 5 kolejnych dni. Pomiar temperatury został przedstawiony w formie wykresu punktowego. Tytuł wykresu to: The air temperature degrees Celsius. Na osi x: the following days oraz wartości 1, 2 , 3, 4, 5, 6. Na osi y: the temperatura degrees Celsius oraz wartości 0, 5, 10, 15, 20, 25. Temperatura w poszczególnych dniach została oznaczona numerami od 1 do 5. Numer 1 - ma współrzędne na wykresie (1, 10). Numer 2 - ma współrzędne na wykresie (2, 15). Numer 3 - ma współrzędne na wykresie (3, 10). Numer 4 - ma współrzędne na wykresie (4, 15). Numer 5 - ma współrzędne na wykresie (5, 20). Na numerach widoczne są podpisy.
Look at the graph and give the following information:
a) the value of the temperature on the second day, b) the value of the temperature on the fifth day, c) the days when the temperature was the lowest, d) the days when the temperature was the highest, e) calculate the arithmetic mean of the air temperature during these days.
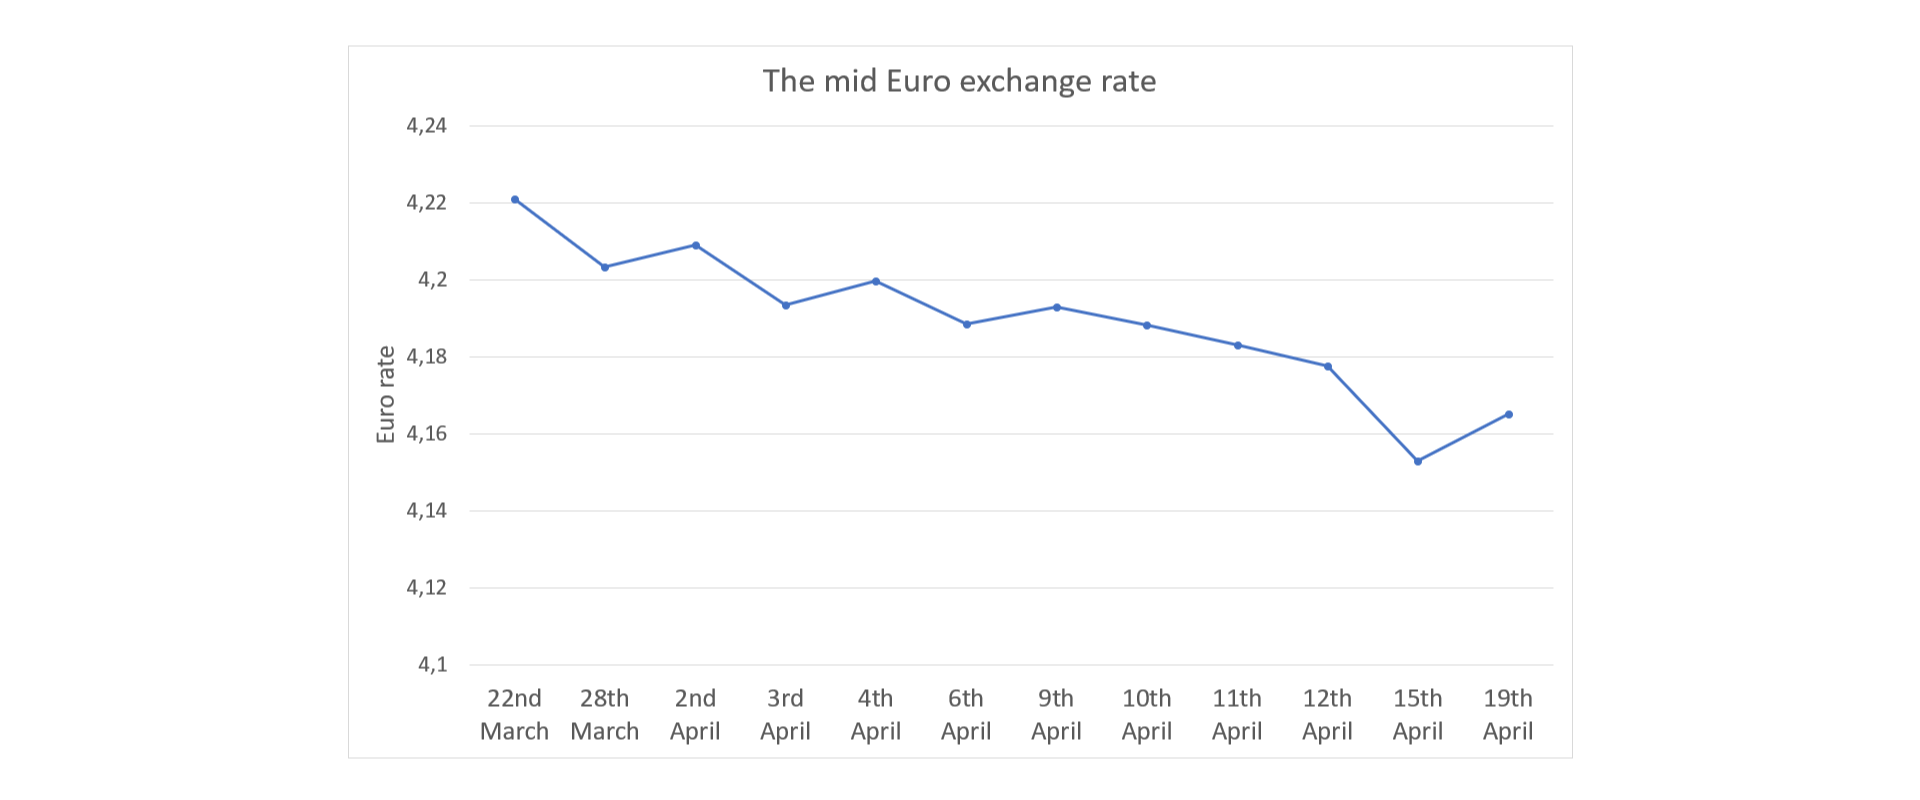
After joining the points with the segments, we get the linear graphlinear graphlinear graph.
Such graphs can be seen in newspapers or on the Internet.
The graph shows the mid Euro exchange rate between 22Indeks górny ndnd of March and 19Indeks górny thth of April 2018.
R1MD4aoG4p3Hk1
Wykres przedstawia zmianę średniego kursu Euro. Na poziomej osi znajdują się wybrane dni. Na osi pionowej średni kur Euro. 22 marca 4,22. 28 marca 4,02. 2 kwietnia 4,21. 3 kwietnia 4,193. 4 kwietnia 4,2 6 kwietnia 4,19. 9 kwietnia 4,194. 10 kwietnia 4,19. 11 kwietnia 4,182. 12 kwietnia 4,179. 15 kwietnia 4,157. 19 kwietnia 4,168.
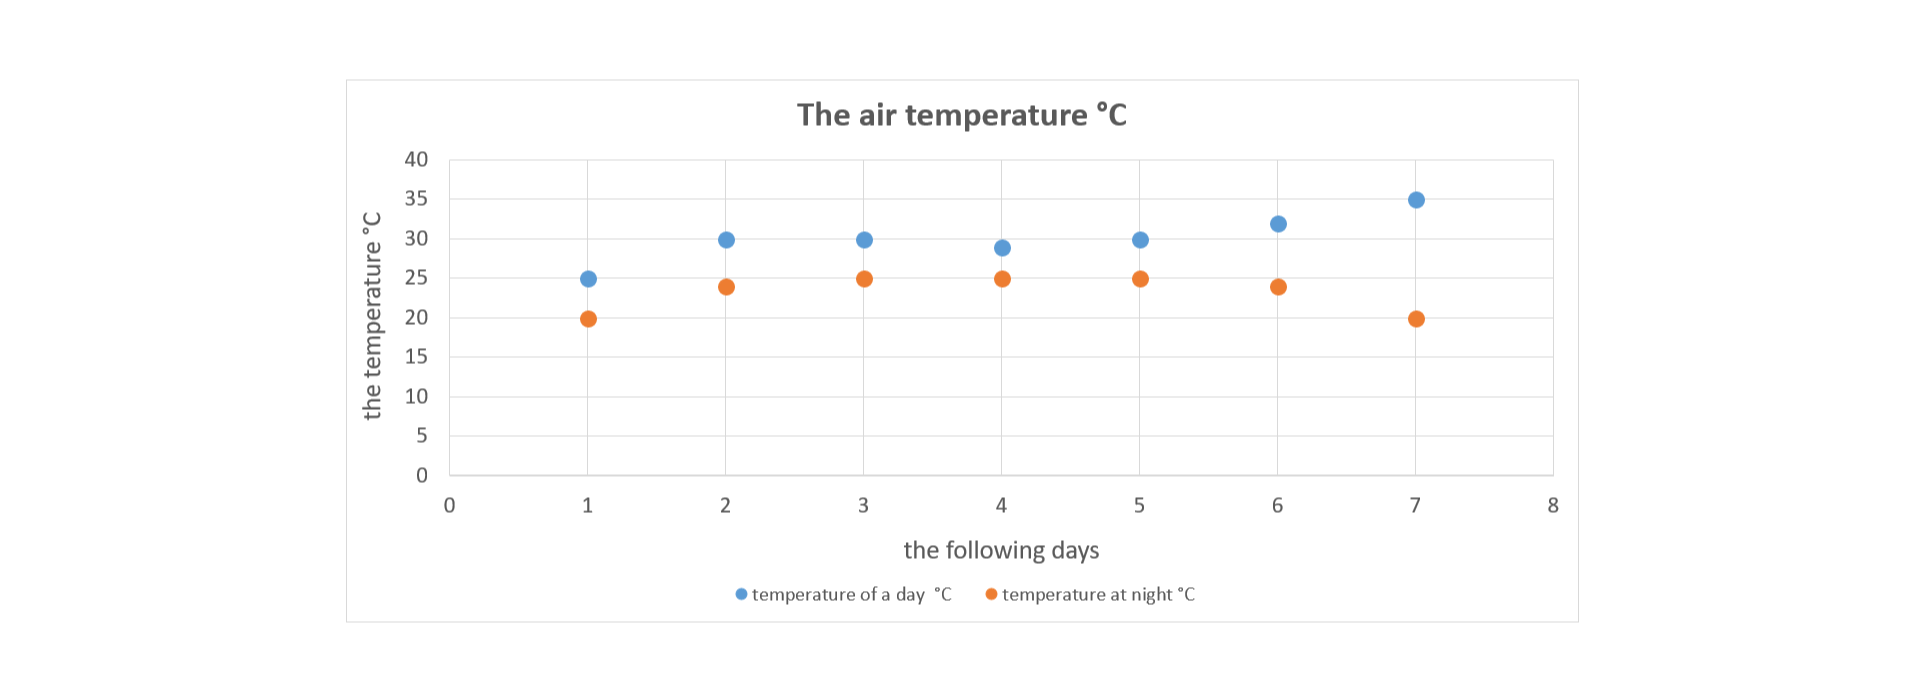
The air temperature in a seaside village was measured at 12 p.m. and 10 p.m. for 8 days and written down on the information board.
RSqqbC8c2rnpV1
Wykres przedstawia temperaturę powietrza w stopniach Celsjusza. Na poziomej osi liczbami od 1 do 7 oznaczone są kolejne dni tygodnia. Na osi pionowej są wartości temperatury od 0 do 40, wyrażone w stopniach Celsjusza. W dniu pierwszym w ciągu dnia 25 stopni, w nocy 20 stopni. W dniu drugim w ciągu dnia 30 stopni, w nocy 24 stopni. W dniu trzecim w ciągu dnia 30 stopni, w nocy 25 stopni. W dniu czwartym w ciągu dnia 29 stopni, w nocy 25 stopni. W dniu piątym w ciągu dnia 30 stopni, w nocy 25 stopni. W dniu szóstym w ciągu dnia 32 stopni, w nocy 24 stopni. W dniu siódmym w ciągu dnia 35 stopni, w nocy 20 stopni.
On the basis of the graph complete the following sentences.
a) The highest temperature was observed on [tu uzupełnij]. b) The smallest difference between the temperatures during the day and at night is [tu uzupełnij]. c) The temperature during the day was 30°C on [tu uzupełnij] and [tu uzupełnij]. d) The lowest temperature at night was observed on [tu uzupełnij].
a) The highest temperature was observed on [tu uzupełnij]. b) The smallest difference between the temperatures during the day and at night is [tu uzupełnij]. c) The temperature during the day was 30°C on [tu uzupełnij] and [tu uzupełnij]. d) The lowest temperature at night was observed on [tu uzupełnij].
a) The highest temperature was observed on……. .
b) The smallest difference between the temperatures during the day and at night is …………. .
c) The temperature during the day was 30°C on ….… and ….… .
d) The lowest temperature at night was observed on ……… .
Task 4
An extra task:
Zosia lives in Czestochowa and her friend Jan lives in Sydney. They decided to measure the air temperature at 12 o’clock for a week and write down the results in the tabletabletable.
Draw two scatter plots illustrating the change of the air temperature in Czestochowa and Sydney (use two different colours).
a) Read the values of the temperature in Czestochowa and Sydney. Note the dates. What can you notice? b) What temperature was in Sydney on the 25Indeks górny thth of July? c) What temperature was in Czestochowa on the 26Indeks górny thth of July? d) In what city was the temperature higher and by how many degrees? e) On which day was the temperature the lowest in Czestochowa and what was its value? f) On which day was the temperature the highest in Sydney and what was its value?g) For how many days did the temperature in Sydney remain the same?
Remember:
The data can be read using the scatter plotscatter plotscatter plot or the linear chart.
We can draw a scatter plot on the basis of the tabletabletable.
Check what you have learned by doing the summarising tasks.
Exercises
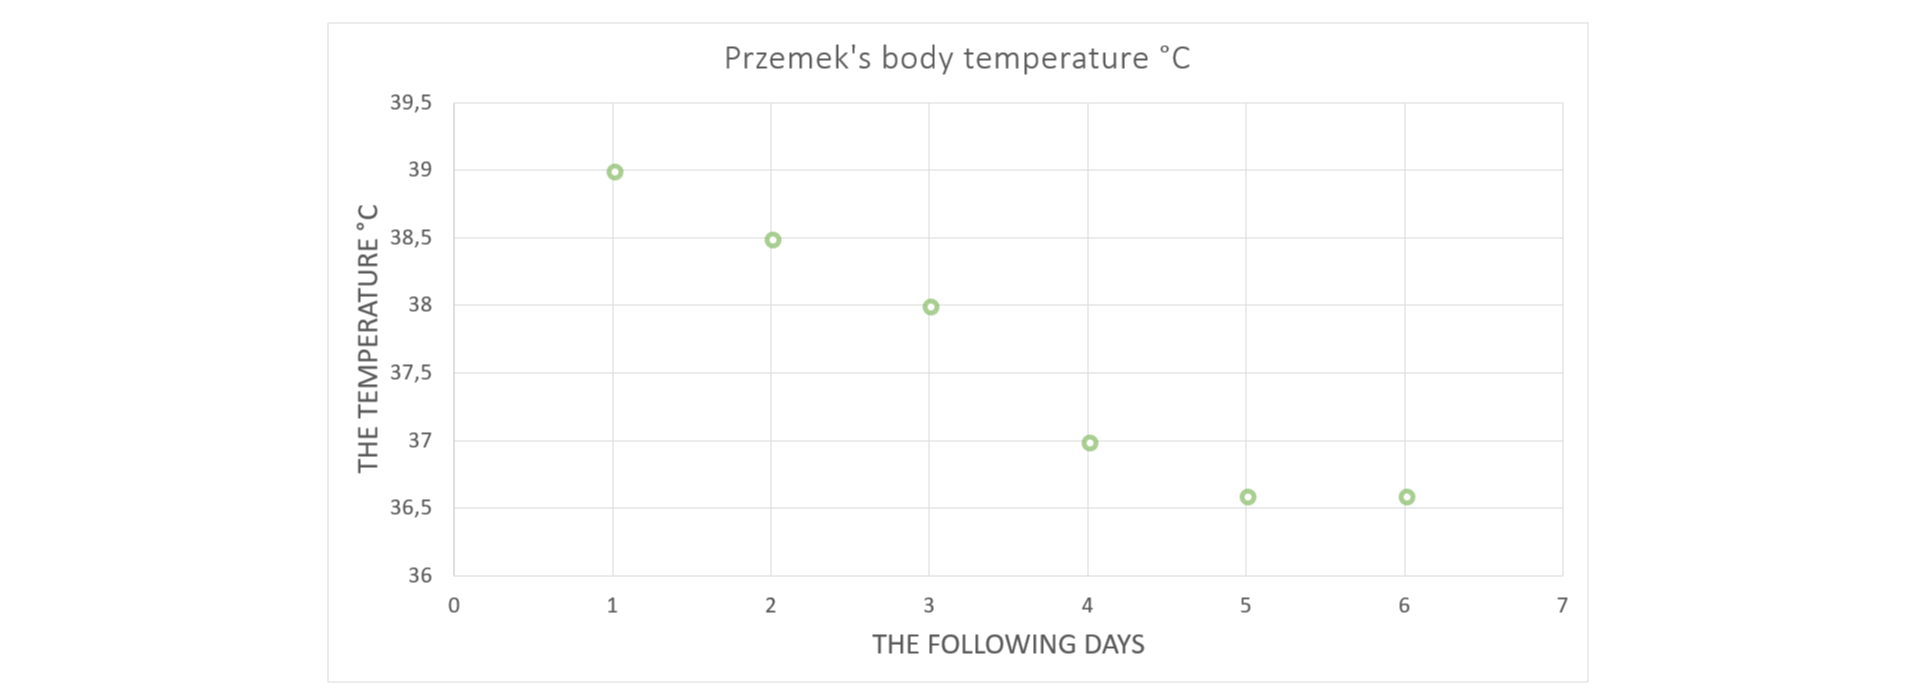
Exercise 1
R1dHdSnuPMn6k1
Wykres przedstawia temperaturę ciała Przemka w stopniach Celsjusza. Na poziomej osi liczbami od 1 do 6 oznaczone są kolejne dni tygodnia. Na osi pionowej są wartości temperatury od 36 do 39 i pół, wyrażone w stopniach Celsjusza. W dniu pierwszym 39 stopni, w dniu drugim 38 i pół stopnia, w dniu trzecim 38 stopni, w dniu czwartym 37, w dniach piątym i szóstym 36 i sześć dziesiątych stopnia.
Source: GroMar, licencja: CC BY 3.0.
R1RaWCyHdKGVh
Wersja alternatywna ćwiczenia: Determine which sentences are true. Możliwe odpowiedzi: 1. On the second day of illness Przemek had the temperature of 38,5 °C., 2. Przemek had the highest temperature on the third day of illness., 3. On the fourth day of illness his temperature was 36,5 °C., 4. Przemek didn’t have the temperature of 36,5 °C.
Wersja alternatywna ćwiczenia: Determine which sentences are true. Możliwe odpowiedzi: 1. On the second day of illness Przemek had the temperature of 38,5 °C., 2. Przemek had the highest temperature on the third day of illness., 3. On the fourth day of illness his temperature was 36,5 °C., 4. Przemek didn’t have the temperature of 36,5 °C.
Determine which sentences are true.
On the second day of illness Przemek had the temperature of 38,5 °C.
Przemek had the highest temperature on the third day of illness.
On the fourth day of illness his temperature was 36,5 °C.
Przemek didn’t have the temperature of 36,5 °C.
zadanie
Source: GroMar, licencja: CC BY 3.0.
Exercise 2
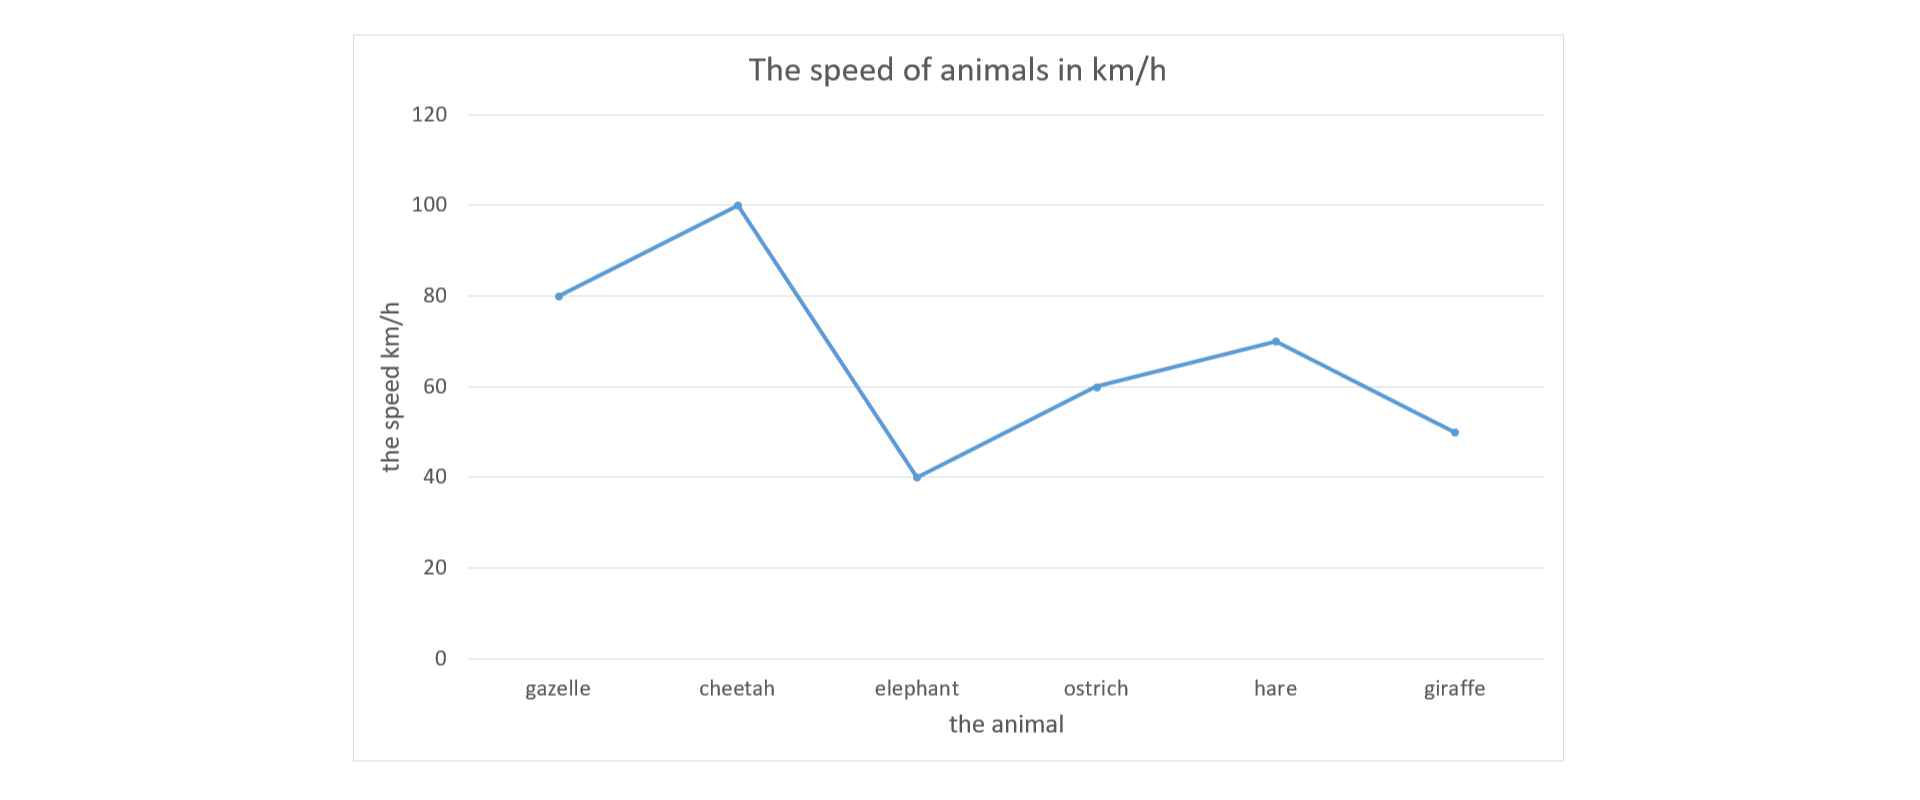
Animals run with various speed.
RfLJ4JmsNPcMI1
Diagram przedstawia szybkość, z jaką poruszają się zwierzęta w kilometrach na godzinę. Na poziomej osi znajdują się nazwy zwierząt. Na osi pionowej prędkość. Gazela (gazelle) porusza się z prędkością 80 kilometrów na godzinę, gepard (cheetah) 100 kilometrów na godzinę, słoń (elephant) 40 kilometrów na godzinę, struś (ostrich) 60 kilometrów na godzinę, zając (hare) 70 kilometrów na godzinę, żyrafa (giraffe) 50 kilometrów na godzinę.
Source: GroMar, licencja: CC BY 3.0.
Answer the following questions:
a) Which of the animals is the fastest?
b) What is the difference between the speed of a cheetah and an elephant?
c) How much faster is a gazelle than an ostrich?
d) How much faster is a gazelle than the elephant?
e) How much slower is a giraffe than a hare?
a) cheetah
b) 60 km/h
c) 20 km/h
d) twice
e) 20 km/h
Exercise 3
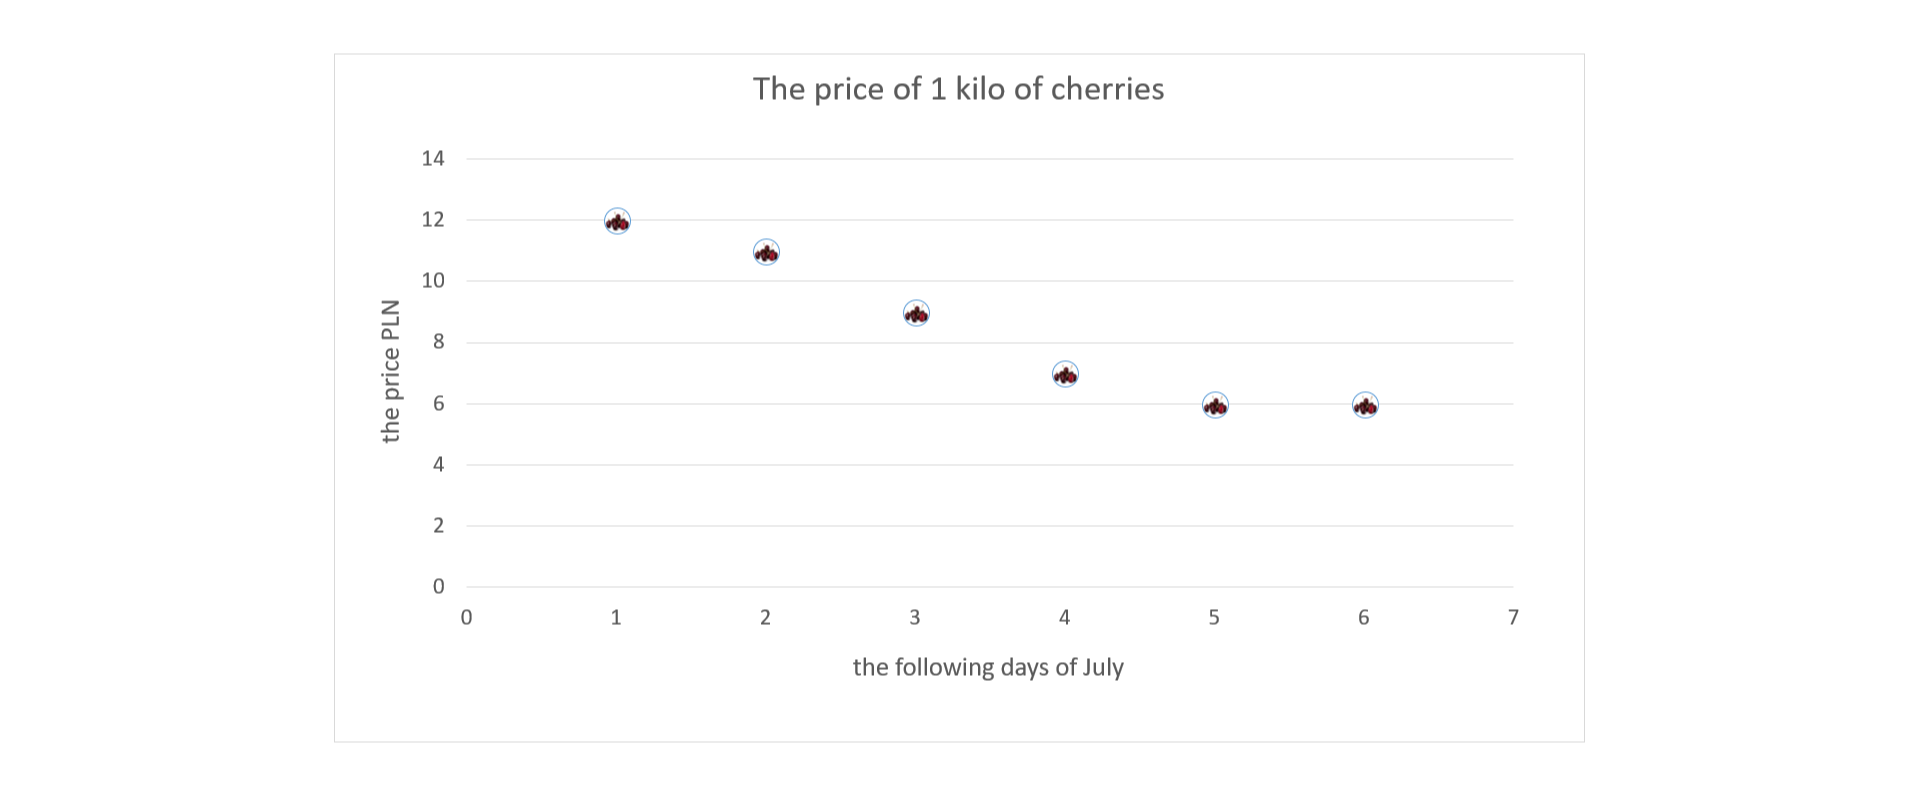
The price of the cherries changed in July. At the beginning of the month the price was higher and then it decreased. The graph presents the change of the price of cherries on consecutive days.
R14s80RkZtkbv1
Wykres przedstawia zmiany ceny jednego kilograma czereśni. Na poziomej osi liczbami od 1 do 6 oznaczone są kolejne dni tygodnia. Na osi pionowej cena kilogram czereśni w PLN. W dniu pierwszym 12 PLN, w dniu drugim 11 PLN, w dniu trzecim 9 PLN, w dniu czwartym 7 PLN, w dniach piątym i szóstym 6 PLN.
Source: GroMar, licencja: CC BY 3.0.
Answer the questions:
a) On which day was the price of one kilo of cherries the highest?
b) On which day did one kilo of cherries cost 7 PLN?
c) How much higher was the price of one kilo of cherries on the 2Indeks górny ndnd of July than on the 4Indeks górny thth of July?
d) Was it possible to pay 10 PLN for 1,5 kilo of cherries? Describe the way of drawing the scatter plot in English.
a) On 1Indeks górny stst of July.
b) On 4Indeks górny thth of July.
c) 4 PLN.
d) Yes.
Exercise 4
R164XE2yOb7XP
Wersja alternatywna ćwiczenia: Indicate which pairs of expressions or words are translated correctly. Możliwe odpowiedzi: 1. wykres punktowy - scatter plot, 2. wykres liniowy - wykres liniowy, 3. tabela - table, 4. przedstawianie danych - interpreting the data, 5. interpretowanie danych - presenting the data
Wersja alternatywna ćwiczenia: Indicate which pairs of expressions or words are translated correctly. Możliwe odpowiedzi: 1. wykres punktowy - scatter plot, 2. wykres liniowy - wykres liniowy, 3. tabela - table, 4. przedstawianie danych - interpreting the data, 5. interpretowanie danych - presenting the data
Indicate which pairs of expressions or words are translated correctly.
wykres punktowy - scatter plot
wykres liniowy - wykres liniowy
tabela - table
przedstawianie danych - interpreting the data
interpretowanie danych - presenting the data
zadanie
Source: GroMar, licencja: CC BY 3.0.
RT7E1pcYPOOeA1
Interaktywna gra, polegająca na łączeniu wyrazów w pary w ciągu jednej minuty. Czas zaczyna upływać wraz z rozpoczęciem gry. Jeden ruch to odkrywanie najpierw jednej potem drugiej karty z wyrazem. Każdy wyraz jest odczytywany. Kolejny ruch to odkrywanie trzeciej i czwartej karty. W ten sposób odsłuchasz wszystkie wyrazy. Nawigacja z poziomu klawiatury za pomocą strzałek, odsłuchiwanie wyrazów enterem lub spacją. Znajdź wszystkie pary wyrazów.
Interaktywna gra, polegająca na łączeniu wyrazów w pary w ciągu jednej minuty. Czas zaczyna upływać wraz z rozpoczęciem gry. Jeden ruch to odkrywanie najpierw jednej potem drugiej karty z wyrazem. Każdy wyraz jest odczytywany. Kolejny ruch to odkrywanie trzeciej i czwartej karty. W ten sposób odsłuchasz wszystkie wyrazy. Nawigacja z poziomu klawiatury za pomocą strzałek, odsłuchiwanie wyrazów enterem lub spacją. Znajdź wszystkie pary wyrazów.
Match Polish terms with their English equivalents.
wykres liniowy
tabela
wykres punktowy
scatter plot
table
linear graph
Source: Zespół autorski Politechniki Łódzkiej, licencja: CC BY 3.0.