Your task is to observe the percentage distribution of population in the world, according to age.
R1OkqsAFm8atk
Ilustracja interaktywna przedstawia poziomy diagram słupkowy zatytułowany The percentage distribution of population in the world, according to age. Na osi poziomej zaznaczono 0 procent, 20 procent, 40 procent, 60 procent, 80 procent. Na osi pionowej słupek over 64 years długości 7 procent, słupek 15 - 64 years długości 66 procent i słupek 0 - 14 years długości 27 procent. Na ilustracji widoczne są numery, a na nich podpisy. 1. 7% {audio}, 2. 66% {audio}, 3. 27% {audio}.
Ilustracja interaktywna przedstawia poziomy diagram słupkowy zatytułowany The percentage distribution of population in the world, according to age. Na osi poziomej zaznaczono 0 procent, 20 procent, 40 procent, 60 procent, 80 procent. Na osi pionowej słupek over 64 years długości 7 procent, słupek 15 - 64 years długości 66 procent i słupek 0 - 14 years długości 27 procent. Na ilustracji widoczne są numery, a na nich podpisy. 1. 7% {audio}, 2. 66% {audio}, 3. 27% {audio}.
The percentage distribution of population in the world, according to age
Statistical datastatistical dataStatistical data is often presented in the form of various diagrams and tables. Most common are bar charts and pie charts.
Based on diagrams and tales we can read conclusions about statistical data.
Discuss the prepared diagram describing statistical datastatistical datastatistical data. Read data and write conclusions. Write propositions of solutions on the idea rug.
Create a thematical poster from prepare materials, with minimum three different diagrams. The poster has to be consistent and interesting graphically. Write information and conclusion under each diagram.
Task 2
An extra task:
Look for information about the surface of voivodeships in Poland. Read and write most important information about greatest and smallest voivodeships in Poland.
Do the revision exercises.
Exercises
Exercise 1
RV3dnTZlhayV11
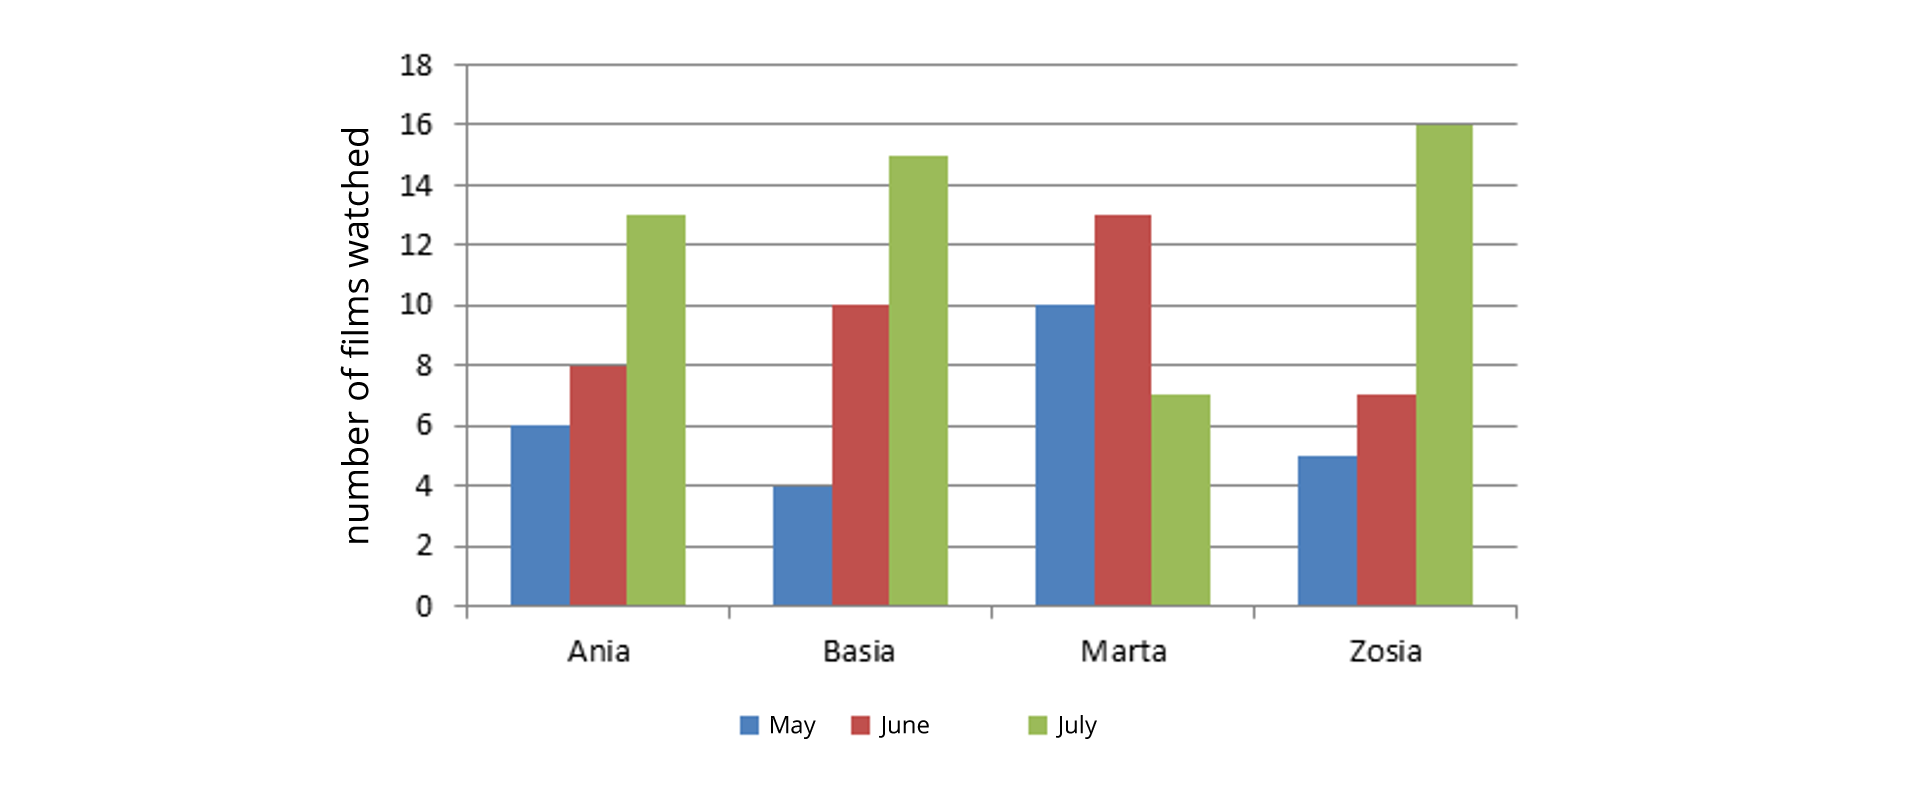
Ilustracja przedstawia diagram słupkowy. Na osi pionowej opisanej number of films watched zaznaczono punkty 0, 2, 4, 6, 8, 10, 12, 14, 16, 18. Na osi poziomej zaznaczono: Ania - słupek niebieski wysokości 6, słupek czerwony wysokości 8, słupek zielony wysokości 13; Basia - słupek niebieski wysokości 4, słupek czerwony wysokości 10, słupek zielony wysokości 15; Marta - słupek niebieski wysokości 10, słupek czerwony wysokości 13, słupek zielony wysokości 7; Zosia - słupek niebieski wysokości 5, słupek czerwony wysokości 7, słupek zielony wysokości 16. Pod diagramem legenda: niebieski - May, czerwony - June, zielony - July.
Source: GroMar, licencja: CC BY 3.0.
RrHSUMfw8Ii5T
Wersja alternatywna ćwiczenia: Determine which sentences are true. Możliwe odpowiedzi: 1. Ania watched the fewest films., 2. The number of films watched by Ania is 10% smaller than the number of films watched by Marta., 3. The number of films watched by Ania and Marta is not equal to the number of films watched by Basia and Zosia., 4. In May, all friends watched the fewest films.
Wersja alternatywna ćwiczenia: Determine which sentences are true. Możliwe odpowiedzi: 1. Ania watched the fewest films., 2. The number of films watched by Ania is 10% smaller than the number of films watched by Marta., 3. The number of films watched by Ania and Marta is not equal to the number of films watched by Basia and Zosia., 4. In May, all friends watched the fewest films.
Determine which sentences are true.
Ania watched the fewest films.
The number of films watched by Ania is 10% smaller than the number of films watched by Marta.
The number of films watched by Ania and Marta is not equal to the number of films watched by Basia and Zosia.
In May, all friends watched the fewest films.
zadanie
Source: GroMar, licencja: CC BY 3.0.
Exercise 2
RJiu9V3BpbHZX1
Ilustracja przedstawia diagram kołowy podzielony na pięć części: niebieską - 28 procent, czerwoną - 24 procent, zieloną - 32 procent, fioletową - 18 procent. Poniżej legenda: niebieski - 40 kg do 49 kg, czerwony - 50 kg do 59 kg, zielony - 60 kg do 69 kg, fioletowy - 70 kg do 79 kg.
Source: GroMar, licencja: CC BY 3.0.
RQcTSm85yDbBV
Wersja alternatywna ćwiczenia: In the percentage diagram there is data about body mass measurements of a group of 25 people. How many people weigh 60 kg or more? Możliwe odpowiedzi: 1. 50%., 2. 21 people., 3. 12 people. How many people weigh less than 70 kg? Możliwe odpowiedzi: 1. 50%., 2. 21 people., 3. 12 people. How many percent less people have the body mass in the interval 50 kg – 59 kg than in the interval 60 kg – 79 kg? Możliwe odpowiedzi: 1. 50%., 2. 21 people., 3. 12 people.
Wersja alternatywna ćwiczenia: In the percentage diagram there is data about body mass measurements of a group of 25 people. How many people weigh 60 kg or more? Możliwe odpowiedzi: 1. 50%., 2. 21 people., 3. 12 people. How many people weigh less than 70 kg? Możliwe odpowiedzi: 1. 50%., 2. 21 people., 3. 12 people. How many percent less people have the body mass in the interval 50 kg – 59 kg than in the interval 60 kg – 79 kg? Możliwe odpowiedzi: 1. 50%., 2. 21 people., 3. 12 people.
In the percentage diagram there is data about body mass measurements of a group of 25 people.
12 people., 50%., 21 people.
How many people weigh 60 kg or more?
How many people weigh less than 70 kg?
How many percent less people have the body mass in the interval 50 kg – 59 kg than in the interval 60 kg – 79 kg?
Exercise 3
Make a questionnaire among your friends “What type of books do you like to read the most?” Present the results in the form of a bar chart.
Describe conclusions drawn from this diagram in English.
Exercise 4
R1G6XX01MMO8m
Wersja alternatywna ćwiczenia: Indicate which pairs of expressions or words are translated correctly. Możliwe odpowiedzi: 1. dane statystyczne - statistical data, 2. tabela - table, 3. odczytywanie danych statystycznych - reading statistical data, 4. diagram kołowy - bar chart, 5. diagram słupkowy - pie chart
Wersja alternatywna ćwiczenia: Indicate which pairs of expressions or words are translated correctly. Możliwe odpowiedzi: 1. dane statystyczne - statistical data, 2. tabela - table, 3. odczytywanie danych statystycznych - reading statistical data, 4. diagram kołowy - bar chart, 5. diagram słupkowy - pie chart
Indicate which pairs of expressions or words are translated correctly.
dane statystyczne - statistical data
tabela - table
odczytywanie danych statystycznych - reading statistical data
diagram kołowy - bar chart
diagram słupkowy - pie chart
zadanie
Source: GroMar, licencja: CC BY 3.0.
RnF3M49Mo7xoR1
Interaktywna gra, polegająca na łączeniu wyrazów w pary w ciągu jednej minuty. Czas zaczyna upływać wraz z rozpoczęciem gry. Jeden ruch to odkrywanie najpierw jednej potem drugiej karty z wyrazem. Każdy wyraz jest odczytywany. Kolejny ruch to odkrywanie trzeciej i czwartej karty. W ten sposób odsłuchasz wszystkie wyrazy. Nawigacja z poziomu klawiatury za pomocą strzałek, odsłuchiwanie wyrazów enterem lub spacją. Znajdź wszystkie pary wyrazów.
Interaktywna gra, polegająca na łączeniu wyrazów w pary w ciągu jednej minuty. Czas zaczyna upływać wraz z rozpoczęciem gry. Jeden ruch to odkrywanie najpierw jednej potem drugiej karty z wyrazem. Każdy wyraz jest odczytywany. Kolejny ruch to odkrywanie trzeciej i czwartej karty. W ten sposób odsłuchasz wszystkie wyrazy. Nawigacja z poziomu klawiatury za pomocą strzałek, odsłuchiwanie wyrazów enterem lub spacją. Znajdź wszystkie pary wyrazów.
Match Polish terms with their English equivalents.
tabela
diagram słupkowy
table
dane statystyczne
pie chart
statistical data
diagram kołowy
bar chart
Source: Zespół autorski Politechniki Łódzkiej, licencja: CC BY 3.0.