Solubility of substances - solubility and solubility curves
that a solution is obtained as a result of dissolution;
that the dissolution rate is influenced by mixing, the fragmentation of the dissolved substance and the increase in temperature.
interpret solubility curves to determine the solubility of a substance;
distinguish the terms: saturated solution, unsaturated solution and dilute solution and concentrated solution;
describe changes in solubility of solids and gases in water depending on temperature.
Solubility
Many substances, e.g. methanol, can be dissolved in water in unlimited amounts. There are substances that only dissolve in it to a small extent (e.g., in quantity g in 100 g water). There are also well‑soluble substances, the amount of which in the solution may exceed four times the mass of water.
Before you watch the movie „Dissolving rock salt and sugar in a certain amount of water and temperature”, Write down the research question and hypotheses. During the movie, pay attention to what happens to the dissolved substances depending on the temperature of the solution and the amount of the diluent. Write down the observations and conclusions.
Film dostępny na portalu epodreczniki.pl
Eksperyment prezentujący roztwory nasycone i nienasycone. Do wykonania eksperymentu wykorzystane są: cukier, sól, bagietka, 3 zlewki z wodą. Laborant wsypuje do kolejnych zlewek cukier, sól i miesza każdą z substancji do momentu rozpuszczenia substancji w wodzie. Masa wody jest zawsze taka sama. Początkowa temperatura wody jest taka sama w obydwu przypadkach i wynosi 20 stopni celsjusza. Na dnie zlewek pozostała nierozpuszczona w wodzie substancja. Otrzymano roztwory nasycone w tej tej temperaturze. Nastęnie roztwory są ogrzewane do temperatury pięcdziesięciu, sześcdziesięciu i siedem dziesięciu stopni celsjusza. W końcowej scenie na ekranie wyświetla się porównanie zawartości zlewek w róznych temperaturach.
What is solubility? How can it be defined by referring to the experiment carried out? Write down your proposal.
The measure of the ability of a substance to dissolve in water is solubilitysolubility. It defines the maximum amount of substance that can dissolve in a fixed mass or volume of solvent at a given temperature and under constant pressure. In physical and chemical tables, solubility is most often expressed as the number of grams of substance that can be dissolved in 100 g of water at a given temperature and under constant pressure. This data was determined experimentally.
On the basis of the data in the table, describe how the solubility of sucrose changes with the temperature. Is the amount of dissolved sucrose increasing or decreasing?
Table 1. Solubility of various solid substances in grams per 100 g of water depending on the temperature.
Temperature | Sodium chloride | Sugar | copper(II) sulfate | potassium nitrate | sodium nitrate | potassium iodide | sodium acetate | potassium chloride |
0 | 35,7 | 179 | 14,3 | 13,3 | 73 | 127,5 | 36,0 | 27,6 |
10 | 35,8 | 17,4 | 20,9 | 80 | 136 | 31,0 | ||
20 | 36,0 | 204 | 20,7 | 31,6 | 88 | 144 | 46,6 | 34,0 |
30 | 36,3 | 25,0 | 45,8 | 96 | 152 | 37,0 | ||
40 | 36,6 | 238 | 28,5 | 63,9 | 104 | 160 | 66,4 | 40,0 |
50 | 37,0 | 33,3 | 85,5 | 114 | 168 | 42,6 | ||
60 | 37,3 | 288 | 40,0 | 110,0 | 124 | 176 | 139,8 | 45,5 |
70 | 37,8 | 47,1 | 138 | 184 | 48,1 | |||
80 | 38,4 | 363 | 55 | 169 | 148 | 192 | 153,2 | 51,1 |
90 | 39,0 | 64,2 | 202 | 200 | 54,0 | |||
100 | 39,8 | 488 | 75,4 | 246 | 180 | 208 | 169,5 | 56,7 |
Sources: Chemical tables, Physicochemical guide, Analyst chemist's guide
Compare how the solubility of gases and solids in water changes with temperature.
Table 2. Solubility of exemplary gaseous substances in grams per 100 g of water depending on the temperature.
Temperature | Carbon dioxide | Oxygen | Nitrogen | Hydrogen |
0 | 0,335 | 0,006948 | 0,00294 | 0,0001982 |
10 | 0,232 | 0,005370 | 0,00231 | 0,0001740 |
20 | 0,169 | 0,004339 | 0,00189 | 0,0001603 |
30 | 0,126 | 0,003508 | 0,00162 | 0,0001474 |
40 | 0,097 | 0,003081 | 0,00139 | 0,0001384 |
50 | 0,076 | 0,002657 | 0,00121 | 0,0001287 |
60 | 0,058 | 0,002274 | 0,00105 | 0,0001178 |
70 | – | 0,001857 | 0,0001021 | |
80 | – | 0,001381 | 0,00066 | 0,0000790 |
90 | – | 0,000787 | 0,0000461 | |
100 | – | 0,0000 | 0,0000 | 0,0000000 |
Sources: Physicochemical guide, Analyst chemist's guide
Solubility curves
On the basis of numerical data showing the dependence of the solubility of the substance on the temperature, a diagram is made called the solubility curvethe solubility curve.
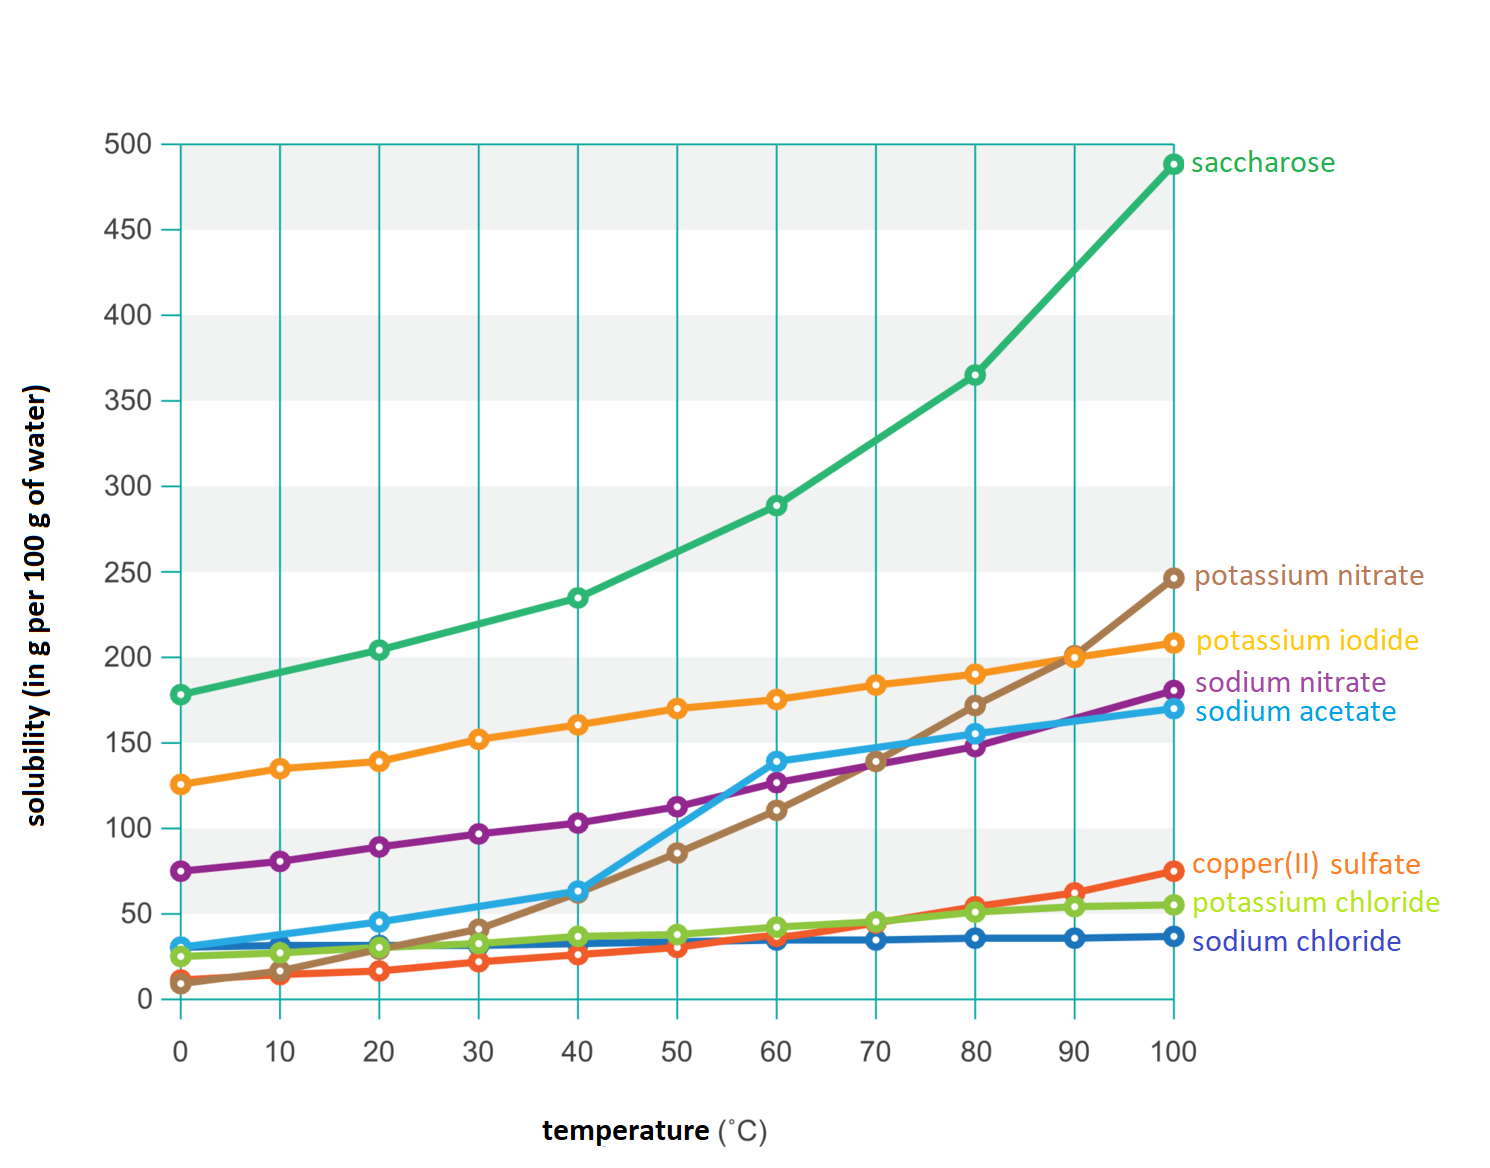
The solubility curve allows you to determine how the solubility of a given substance changes depending on the temperature. It also provides information whether it is a significant change or a small change. From the graph you can also read the amount of substance that can dissolve up to 100 g of water.
Group the factors that affect the solubility of the substance in water and the rate of dissolution of the substance
temperature, temperature, type of substance, disintegration of a solute, mixing
| The solubility depends on: | |
|---|---|
| The rate of dissolution of a substance depends on: |
Indicate correct answers
- The number of grams of substance that can be dissolved in 100 g of water to form a solution saturated at a given temperature is called the solubility of the substance
- The dependence of the solubility of substances on the pressure is presented by means of a solubility curve
- With the lowering of the temperature, the solubility of solids decreases and the solubility of gases increases
- The solubility of gases in water increases with increasing pressure
Summary
Different amounts of various substances dissolve in the same volume of water.
The amount of solid dissolved in water depends on the temperature and usually grows with its increase.
As the temperature rises, the amount of gas dissolved in the water decreases.
The maximum amount of substance that can dissolve in a fixed mass or volume of solvent at a given temperature and under constant pressure is called solubility. It can be expressed as the number of grams of substance that can be dissolved in 100 g of solvent at a given temperature and under constant pressure.
The graph showing the dependence of the solubility of a given substance on the temperature is called the solubility curve.
Keywords
solubility curve, solubility, saturated solution, unsaturated solution, concentrated solution, dilute solution
Glossary
krzywa rozpuszczalności – wykres przedstawiający zależność rozpuszczalności danej substancji od temperatury
rozpuszczalność – określa maksymalną ilość substancji, jaka może rozpuścić się w 100 g rozpuszczalnika w danej temperaturze i pod stałym ciśnieniem
roztwór nasycony – roztwór, który w danej temperaturze zawiera maksymalną ilość substancji rozpuszczonej, a dodana kolejna do niej porcja substancji nie ulega rozpuszczeniu
roztwór nienasycony – roztwór, który w danej temperaturze nie zawiera maksymalnej ilości substancji rozpuszczonej i w którym można rozpuścić dodatkową porcję tej substancji
roztwór rozcieńczony – roztwór, który zawiera co najmniej kilkakrotnie mniej substancji rozpuszczonej niż roztwór stężony
roztwór stężony – roztwór, w którym ilość substancji rozpuszczonej jest taka sama jak w roztworze nasyconym lub niewiele mniejsza