The air temperature changes in the subsequent atmosphere layers in a very wide range. However, we are most interested in the temperature in the lower troposphere, the Earth's surface, and how it changes throughout the day and the year. Since it depends on so many factors, it is difficult to predict its values and fluctuations. Weather forecasting, including the air temperature, is a job for the department of meteorology.
Elements affecting temperature changes
Zones, seasons, time
Observed temperatures
Geographical location
the Tropics
high
the temperate zone
medium
the Arctic zones
low
Height above sea level
lowlands and highlands
high
mountains
low
Geographical location
within continents in summer
high
within continents in winter
low
coasts in summer
low
coasts in winter
high
Season
summer
high
winter
low
Time during the day
day
high
night
low
As the altitude rises, the air temperature usually drops by 0.6°C every 100 m, but in the case of completely dry air, it can even drop by 1°C every 100 m. In some areas there are exceptions and then the valleys are cooler than the mountain peaks. This phenomenon is called air temperature inversiontemperature inversionair temperature inversion. What also affects the air temperature: cloudiness, vegetation or lack thereof, direction of terrain slope, sea currents and even human activities. Only after combining all these components can we understand, how difficult it is to predict the temperature of a given area and how often it changes in both time and space. Air thermal variability in a given area is characterized by air temperature variationtemperature variationair temperature variation – the difference between the highest and lowest value measured in a given period. For example, one of the largest diurnal air temperature variationsdiurnal temperature variationdiurnal air temperature variations - differences between the maximum and minimum temperature measured during the day, occur in deserts near the Tropics. During the day, the air heats up, and at night the temperature can drop even below 0°C. Diurnal temperature variation can reach several dozen degrees Celsius. On the other hand, one of the largest annual air temperature variationsannual temperature variationannual air temperature variations – differences between the average monthly temperature of the warmest month and the average temperature of the coldest month – occurs in higher latitudes and away from the sea and ocean shores. For example, we have the Siberian Oymyakon, where the annual amplitude reached 104°C (-71°C – the average temperature in January, 33°C – the average temperature in July).
Rdaj04gOrn4my
Ilustracja przedstawiająca temperaturę powietrza na mapie świata w Styczniu (World map - air temperature in January) oraz występujące na niej izotermy stycznia (January isotherms). Temperatury -50 stopni Celsjusza występują w centralnej części Grenlandii oraz na północy i północnym-wschodzie Rosji. Temperatury od -40 do 0 stopni Celsjusza występują na Antarktydzie, od -40 do -20 w północnej części Ameryki Północnej, północnej części Azji. Temperatury -10 stopni Celsjusza występują w Eurazji i środkowej części Ameryki Północnej. Temperatury 0 stopni Celsjusza występują w południowej części Ameryki Północnej, północnej części Afryki, zachodniej części Europy, na Bliskim Wschodzie i w Chinach. Temperatury +10 stopni Celsjusza występują w południowej części Ameryki Północnej, północnej części Afryki, południowej części Azji. Temperatury +20 i +30 stopni Celsjusza występują w Ameryce Południowej, Afryce, Australii i Indonezji. Powyżej 30 stopni północna i zachodnia część Australii, w głąb kontynentu.
Ilustracja przedstawiająca temperaturę powietrza na mapie świata w Styczniu (World map - air temperature in January) oraz występujące na niej izotermy stycznia (January isotherms). Temperatury -50 stopni Celsjusza występują w centralnej części Grenlandii oraz na północy i północnym-wschodzie Rosji. Temperatury od -40 do 0 stopni Celsjusza występują na Antarktydzie, od -40 do -20 w północnej części Ameryki Północnej, północnej części Azji. Temperatury -10 stopni Celsjusza występują w Eurazji i środkowej części Ameryki Północnej. Temperatury 0 stopni Celsjusza występują w południowej części Ameryki Północnej, północnej części Afryki, zachodniej części Europy, na Bliskim Wschodzie i w Chinach. Temperatury +10 stopni Celsjusza występują w południowej części Ameryki Północnej, północnej części Afryki, południowej części Azji. Temperatury +20 i +30 stopni Celsjusza występują w Ameryce Południowej, Afryce, Australii i Indonezji. Powyżej 30 stopni północna i zachodnia część Australii, w głąb kontynentu.
World map - air temperature in January
Source: licencja: CC BY 3.0.
RayA4UI3mXe33
Ilustracja przedstawiająca temperaturę powietrza na mapie świata w Lipcu (World map - air temperature in July) oraz występujące na niej izotermy lutego (July isotherms). Temperatury od -50 do -20 Antarktyda. Od -20 do zera stopni północna część Ameryki Północnej. Temperatury od zera do 10 stopni: północna część Rosji, południowa część Ameryki Południowej, Afryki, południowo-wschodnia część Australii, centralna część Chin. Pomiędzy 10 a 20 stopni znaczna część Azji, Europy, Ameryki Północnej, niella cała Australia. Od 20 do 30 stopni: Stany Zjednoczone, Ameryka Łacińska, Azja południowa, centralne, północne oraz zachodnie obszary Afryki, północna Australia. Temperatury powyżej 30 stopni: niewielki obszar na zachodzie Stanów Zjednoczonych, północna część Afryki, obrzeża Półwyspu Arabskiego.
Ilustracja przedstawiająca temperaturę powietrza na mapie świata w Lipcu (World map - air temperature in July) oraz występujące na niej izotermy lutego (July isotherms). Temperatury od -50 do -20 Antarktyda. Od -20 do zera stopni północna część Ameryki Północnej. Temperatury od zera do 10 stopni: północna część Rosji, południowa część Ameryki Południowej, Afryki, południowo-wschodnia część Australii, centralna część Chin. Pomiędzy 10 a 20 stopni znaczna część Azji, Europy, Ameryki Północnej, niella cała Australia. Od 20 do 30 stopni: Stany Zjednoczone, Ameryka Łacińska, Azja południowa, centralne, północne oraz zachodnie obszary Afryki, północna Australia. Temperatury powyżej 30 stopni: niewielki obszar na zachodzie Stanów Zjednoczonych, północna część Afryki, obrzeża Półwyspu Arabskiego.
World map - air temperature in July
Source: World map - air temperature in July, licencja: CC BY 3.0.
RWxRqUye7i4Zt
Mapa zatytułowana World map - annual average air temperature. Na mapie przdstawiono całą powierzchnię Ziemi z zaznaczonymi kontynentami - Ameryka Północna, Ameryka Południowa, Afryka, Europa, Azja, Australia, Arktyka i Antarktyda. Poszczególnymi kolorami oznaczono izotermy roczne w skali od minus 30 stopni Celcjusza do plus 20 stopni Celcjusza. Najcieplejsze strefy oznaczone są w położonych najbliżej równika Ameryce Południowej, Afryce, Australii i częściowo południowej Azji. Im bliżej z kolei biegunów, tym średnioroczne temperatury są niższe.
Mapa zatytułowana World map - annual average air temperature. Na mapie przdstawiono całą powierzchnię Ziemi z zaznaczonymi kontynentami - Ameryka Północna, Ameryka Południowa, Afryka, Europa, Azja, Australia, Arktyka i Antarktyda. Poszczególnymi kolorami oznaczono izotermy roczne w skali od minus 30 stopni Celcjusza do plus 20 stopni Celcjusza. Najcieplejsze strefy oznaczone są w położonych najbliżej równika Ameryce Południowej, Afryce, Australii i częściowo południowej Azji. Im bliżej z kolei biegunów, tym średnioroczne temperatury są niższe.
World map - annual average air temperature
Source: World map - annual average air temperature, licencja: CC BY 3.0.
RnRFNzAD6V2VR
Mapa o tytule - World map - distribution of the annual temperature variation on Earth - przedstawiająca roczne amplitudy temperatury powietrza. Na mapie przedstawiono całą Ziemię wraz z kontynentami i morzami. Oznaczone są Ameryka Północna, Ameryka Południowa, Afryka, Europa, Azja, Australia, Arktyka i Antarktyda. Poszczególnymi kolorami oznaczono roczne izoamplitudy temperatury powietrza. Skala obejmuje amplitudy temperatur od dwóch i pół stopnia Celcjusza do 60 stopni Celcjusza. Z mapy wynika, że największe roczne amplitudy temperatur występują na północy Ameryki Północnej i Azji, w pobliżu bieguna północnego. Z kolei pas z najniższymi wahaniami temperatury występuje wzdłuż równika.
Mapa o tytule - World map - distribution of the annual temperature variation on Earth - przedstawiająca roczne amplitudy temperatury powietrza. Na mapie przedstawiono całą Ziemię wraz z kontynentami i morzami. Oznaczone są Ameryka Północna, Ameryka Południowa, Afryka, Europa, Azja, Australia, Arktyka i Antarktyda. Poszczególnymi kolorami oznaczono roczne izoamplitudy temperatury powietrza. Skala obejmuje amplitudy temperatur od dwóch i pół stopnia Celcjusza do 60 stopni Celcjusza. Z mapy wynika, że największe roczne amplitudy temperatur występują na północy Ameryki Północnej i Azji, w pobliżu bieguna północnego. Z kolei pas z najniższymi wahaniami temperatury występuje wzdłuż równika.
World map - distribution of the annual temperature variation on Earth
Source: World map - distribution of the annual temperature variation on Earth, licencja: CC BY 3.0.
Task 1
Calculate the difference between the temperature of the humid air above Morskie Oko - the largest lake of the Polish Tatras, located at an altitude of 1,395 m above sea level. – and Rysy – the highest peak in the Polish Tatras at an altitude of 2,499 m above sea level. To simplify the calculations, you can round the given heights to hundreds of meters.
Task 2
According to the average monthly air temperature in a certain place in Poland, calculate the average annual temperature. Calculate the annual amplitude of monthly average temperature values in this place.
MONTH
MONTHLY AVERAGE AIR TEMPERATURE
January
-3.3°C
February
-2.1°C
March
1.9°C
April
7.7°C
May
13.5°C
June
16.7°C
July
18.0°C
August
17.3°C
September
13.1°C
October
8.2°C
November
3.2°C
December
-1.0°C
R12ilj1Rgfn3o
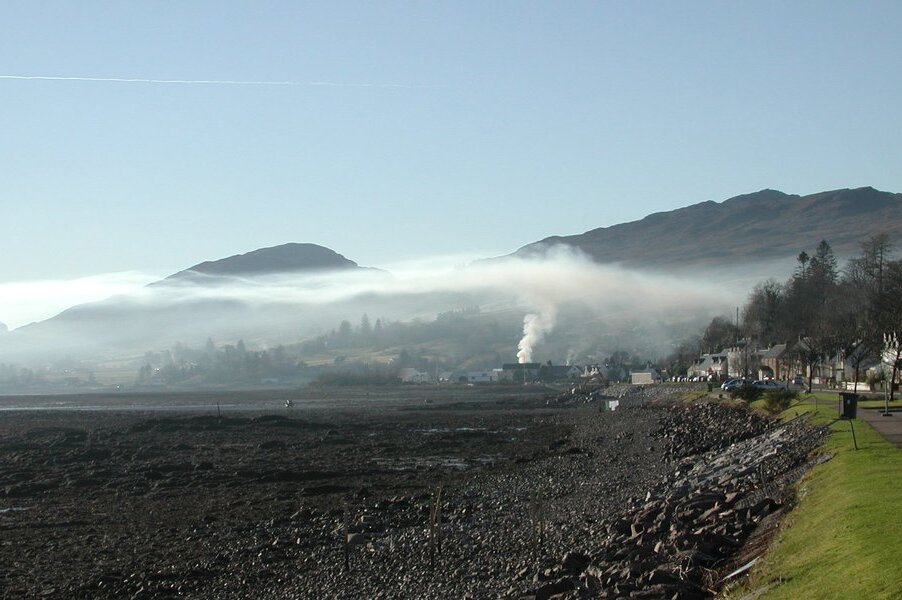
Fotografia barwna. Ilustracja przedstawia krajobraz górski. Zdjęcie prezentuje również pole uprawne oraz wieś. Z komina jednego z domów unosi się dym. Dym rozchodzi się po całej dolinie.
The rising smoke stopped by a layer of warm air above.
Source: licencja: CC BY-SA 3.0, [online], dostępny w internecie: www.wikipedia.pl.
Change in contamination in the atmosphere caused by inversion
Source: licencja: CC BY-SA 4.0, [online], dostępny w internecie: www.wikipedia.pl.
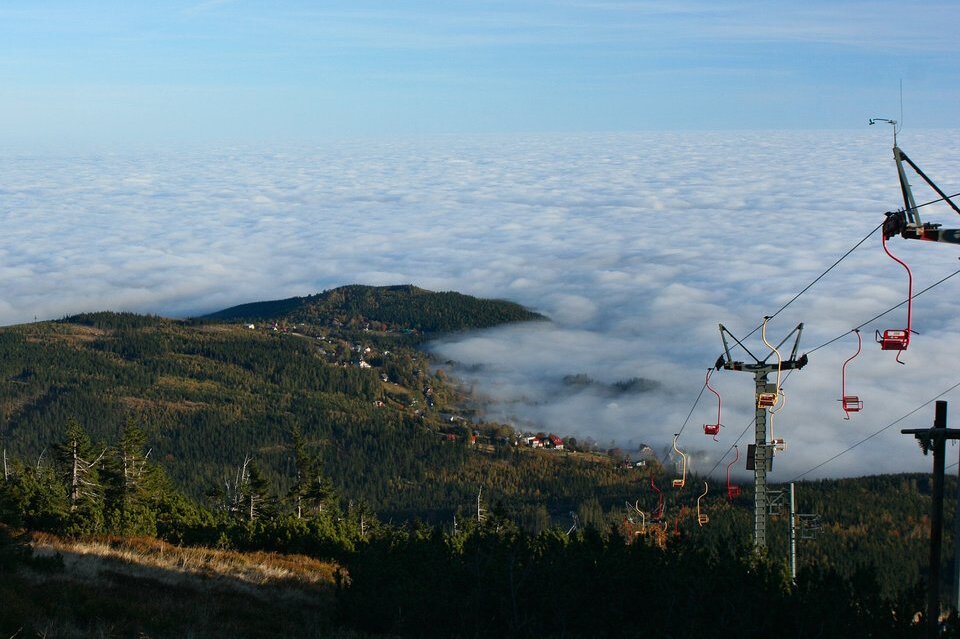
Ro5GuMre9kFWz
Fotografia barwna. Ilustracja przestawia widok na dolinę, która otaczają chmury. W prawym rogu fotografii znajduje się wyciąg krzesełkowy.
A significant temperature inversion that keeps clouds above the Jelenia Góra Valley. View from Kopa on Karpacz.
Source: licencja: CC BY-SA 3.0, [online], dostępny w internecie: www.wikipedia.pl.
Air temperature measurement
Observation 1
Practising the ability to measure atmospheric air pressure. Learning the air temperature at 2 m above the ground.
Raising awareness of the changes in air temperature in the lower troposphere.
You will need
window thermometer.
Instruction
Place the thermometer in the shade in a ventilated area at a height of 2 m above the ground.
Check the thermometer reading, providing the correct temperature unit.
Read the extreme possible measurements of the thermometer, which probably exceed the temperature range of the atmospheric air present in Poland.
RcNFfH9qnQgZ5
Exercise 1
Match the definition to the concept: air temperature inversion, air temperature variation, diurnal air temperature variation, annual temperature variation. Możliwe odpowiedzi: 1. the difference between the monthly average temperature of the warmest month and the average monthly temperature of the coldest month, 2. the difference between the highest and lowest temperatures measured in a given day, 3. the difference between the maximum and minimum value of observed temperatures in a given period, 4. a meteorological phenomenon occurring in the lower atmosphere, in which the temperature rises with altitude
Match the definition to the concept: air temperature inversion, air temperature variation, diurnal air temperature variation, annual temperature variation. Możliwe odpowiedzi: 1. the difference between the monthly average temperature of the warmest month and the average monthly temperature of the coldest month, 2. the difference between the highest and lowest temperatures measured in a given day, 3. the difference between the maximum and minimum value of observed temperatures in a given period, 4. a meteorological phenomenon occurring in the lower atmosphere, in which the temperature rises with altitude
Match the definition to the concept.
the difference between the highest and lowest temperatures measured in a given day, the difference between the maximum and minimum value of observed temperatures in a given period, the difference between the monthly average temperature of the warmest month and the average monthly temperature of the coldest month, a meteorological phenomenon occurring in the lower atmosphere, in which the temperature rises with altitude
air temperature inversion
air temperature variation
diurnal air temperature variation
annual temperature variation
R1RdBFVyVSCMW
Exercise 2
Wysłuchaj nagrań słówek w słowniczku i naucz się ich prawidłowej wymowy.
Wysłuchaj nagrań słówek w słowniczku i naucz się ich prawidłowej wymowy.
Examples of thermometers of different construction and purpose
Source: licencja: CC BY 3.0.
Rszd51lyFBygC
Exercise 3
Calculate the air temperature at the top of the mountain if it is 15°C in the valley 1,500 m below and the air is very dry. Select the correct answer. Możliwe odpowiedzi: 0°C, 4°C, 9°C, 15°C
Calculate the air temperature at the top of the mountain if it is 15°C in the valley 1,500 m below and the air is very dry. Select the correct answer. Możliwe odpowiedzi: 0°C, 4°C, 9°C, 15°C
Calculate the air temperature at the top of the mountain if it is 15°C in the valley 1,500 m below and the air is very dry. Select the correct answer.
0°C
4°C
9°C
15°C
R3jXwFg7T04PO
Exercise 4
Select all factors that affect air temperature in a given place and time. Możliwe odpowiedzi: 1. cloudiness, 2. vegetation, 3. terrain, 4. sea currents, 5. season, 6. human activities, 7. groundwater, 8. time of day
Select all factors that affect air temperature in a given place and time. Możliwe odpowiedzi: 1. cloudiness, 2. vegetation, 3. terrain, 4. sea currents, 5. season, 6. human activities, 7. groundwater, 8. time of day
Select all factors that affect air temperature in a given place and time
cloudiness
vegetation
terrain
sea currents
season
human activities
groundwater
time of day
Summary
The air temperature near Earth's surface depends on many different natural factors and on human activity.
1
Keywords
air temperature inversion, air temperature variation, diurnal air temperature variation, annual air temperature variation.
amplituda roczna temperatury powietrza – różnica pomiędzy średnią miesięczną temperaturą miesiąca najcieplejszego a średnią miesięczną temperaturą miesiąca najchłodniejszego
inwersja termiczna – zjawisko meteorologiczne zachodzące w dolnej warstwie atmosfery, polegające, odwrotnie niż w zazwyczaj spotykanych warunkach, na wzroście temperatury wraz z wysokością