The task below will help you review your knowledge of the formula of the functionfunctionfunction whose graph you get as a result of shifting the graph of the functiongraph of the functiongraph of the function along the axis of the coordinate system.
a. The graph of the functiongraph of the functiongraph of the function y=2(x‑2)Indeks górny 22 is obtained by shifting the graph of the functiongraph of the functiongraph of the function y=2xIndeks górny 22 by 2 values to the right along the axis X.
b. The graph of the functiongraph of the functiongraph of the function y=-3xIndeks górny 22-2 is obtained as a result of shifting the graph of the functiongraph of the functiongraph of the function y = -3xIndeks górny 22 by 2 values upwards along the axis X.
c. After shifting the functionfunctionfunction graph y=-2xIndeks górny 22 by three values to the left along the X axis, we obtain a graph of the functiongraph of the functiongraph of the function y = -2(x+3)Indeks górny 22.
d. After shifting the graph of the functiongraph of the functiongraph of the function y=xIndeks górny 22 by four values down along the X axis, we get a graph of the functiongraph of the functiongraph of the function y=xIndeks górny 22-4.
The aim of the lesson will be to draw graphs of functions obtained as a result of shifting the graphshifting the graphshifting the graph of the function along the axis of the coordinate system.
To make a graph of the functiongraph of the functiongraph of the function , first we sketch the graph of the functiongraph of the functiongraph of the function , and then we shift the obtained graph along the Y axis by values.
The asymptotes of the graphasymptotes of the graphasymptotes of the graph are straight lines: - a horizontal asymptoteasymptoteasymptote and - a vertical asymptoteasymptoteasymptote.
In order to make a graph of the functiongraph of the functiongraph of the function , one should first draw the graph of the functiongraph of the functiongraph of the function , and then shift it along the axis X by values.
The asymptotes of the graphasymptotes of the graphasymptotes of the graph are straight lines: - a vertical asymptoteasymptoteasymptote, - a horizontal asymptoteasymptoteasymptote.
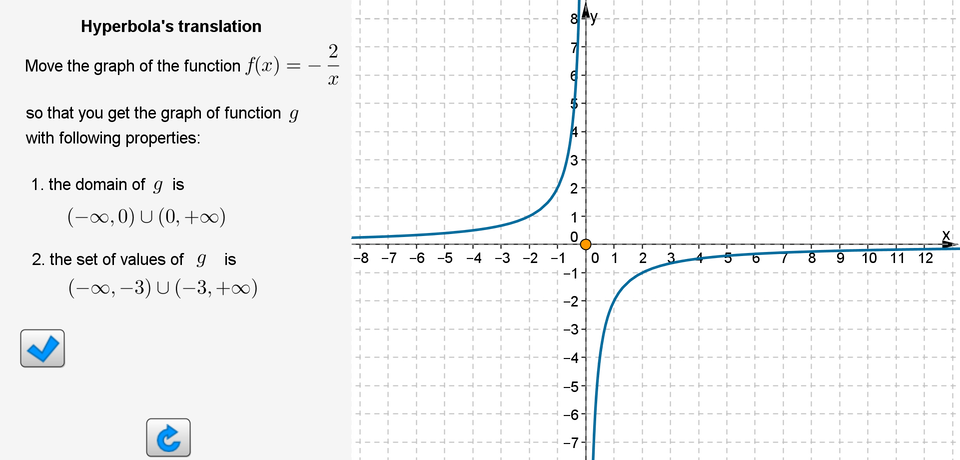
Think how a graph of the functiongraph of the functiongraph of the function can be obtained. The material contained in the applet will help you. Formulate the appropriate conclusions.
Analyze the material contained in the applet. Describe the properties of the functionfunctionfunction on the basis of its graph. Formulate the appropriate conclusion.
R1IjtME4eL6yA1
Aplet geogebry. Przesuwanie hiperboli. Poniżej znajduje się galeria będąca wersją alternatywną dla aplikacji.
Aplet geogebry. Przesuwanie hiperboli. Poniżej znajduje się galeria będąca wersją alternatywną dla aplikacji.
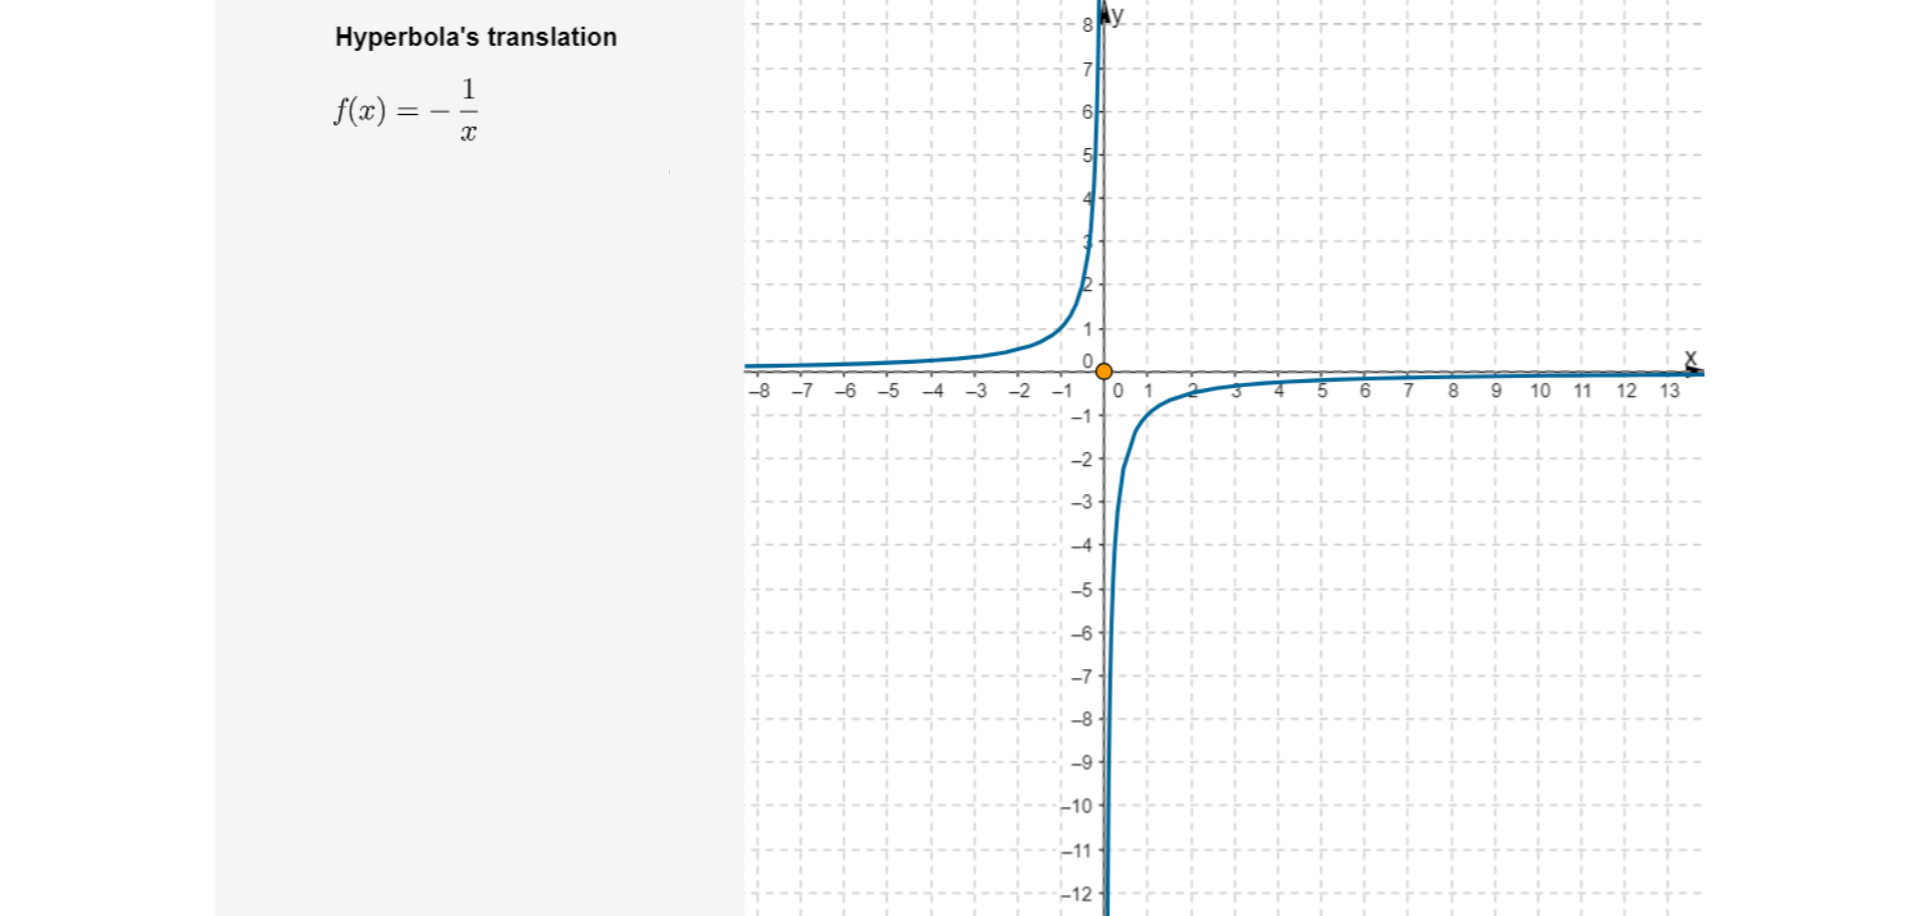
Na ilustracji narysowany jest układ współrzędnych. Oś pozioma jest oznaczona małą literą x. Na osi umieszczone są liczby od minus osiem do trzynastu. Oś pionowa jest oznaczona małą literą y. Na osi umieszczone są liczby od minus dwanaście do ośmiu. W drugiej i czwartej ćwiartce układu współrzędnych umieszczona jest hiperbola będąca wykresem funkcji f od x równa się minus jeden nad x. Wyróżniony jest punkt, który jest początkiem układu współrzędnych.
Moving hyperbole - 1
Source: GroMar, licencja: CC BY 3.0.
R1Wj6mz4RckIo
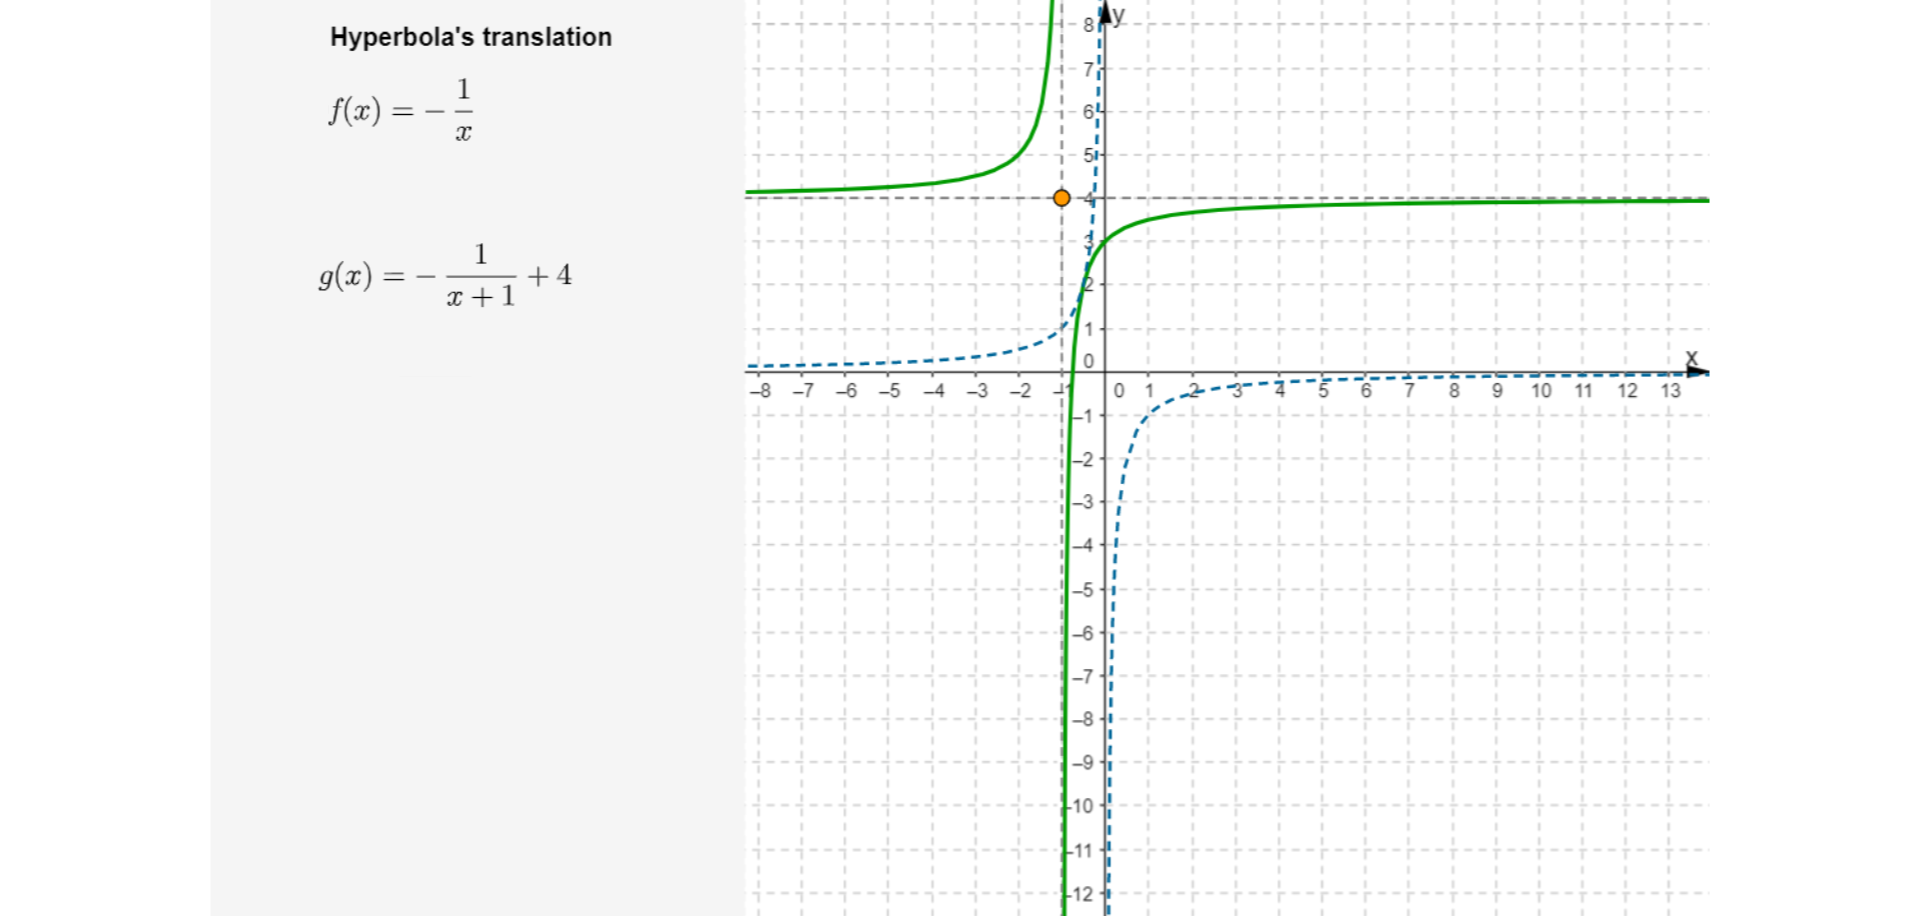
Po prawej stronie rysunku narysowany jest układ współrzędnych. Oś pozioma jest oznaczona małą literą x. Na osi umieszczone są liczby od minus osiem do trzynastu. Oś pionowa jest oznaczona małą literą y. Na osi umieszczone są liczby od minus dwanaście do ośmiu. W drugiej i czwartej ćwiartce układu współrzędnych umieszczona jest hiperbola będąca wykresem funkcji f od x równa się minus jeden nad x. W tym samym układzie współrzędnych narysowany jest wykres funkcji g od x równa się minus ułamek, w liczniku jeden, w mianowniku x dodać jeden, poza ułamkiem dodać cztery. Wyróżniony punkt ma współrzędne: x równa się minus jeden, y równa się cztery.
To draw a functionfunctionfunction , first draw the function , then shift each point of this graph along the X axis by values and along the Y by values.
The asymptotes of the graphasymptotes of the graphasymptotes of the graph are straight lines: - a vertical asymptoteasymptoteasymptote, - a horizontal asymptoteasymptoteasymptote.
To draw a functionfunctionfunction , first sketch the functionfunctionfunction , then shift each point of this graph along the X axis by values and along the Y by values.
The asymptotes of the graphasymptotes of the graphasymptotes of the graph are straight lines: - a vertical asymptoteasymptoteasymptote, - a horizontal asymptoteasymptoteasymptote.
Task 1
a) True b) False c) True d) True
Exercises
R8ZiO7APnZA6i
Exercise 1
Wersja alternatywna ćwiczenia: Determine which sentence is true. Możliwe odpowiedzi: 1. A vertical asymptote of the function graph is a straight line ., 2. A horizontal asymptote of the function graph is a straight line .
Wersja alternatywna ćwiczenia: Determine which sentence is true. Możliwe odpowiedzi: 1. A vertical asymptote of the function graph is a straight line ., 2. A horizontal asymptote of the function graph is a straight line .
Determine which sentence is true.
A vertical asymptote of the function graph is a straight line .
A horizontal asymptote of the function graph is a straight line .
Exercise 2
Sketch the graph of the function . Give the graph asymptote equations. Specify the properties of the function.
Exercise 3
In English describe the properties of the following function .
Exercise 4
Rw6mnD9MizR0y
Wersja alternatywna ćwiczenia: Indicate which pairs of expressions or words are translated correctly. Możliwe odpowiedzi: 1. wykres funkcji - graph of the function, 2. dziedzina funkcji - domain of the function, 3. asymptoty wykresu - asymptotes of the graph, 4. zbiór wartości funkcji - set of values of the function, 5. miejsce zerowe funkcji - monotonicity of the function, 6. monotoniczność funkcji - zero points of the function
Wersja alternatywna ćwiczenia: Indicate which pairs of expressions or words are translated correctly. Możliwe odpowiedzi: 1. wykres funkcji - graph of the function, 2. dziedzina funkcji - domain of the function, 3. asymptoty wykresu - asymptotes of the graph, 4. zbiór wartości funkcji - set of values of the function, 5. miejsce zerowe funkcji - monotonicity of the function, 6. monotoniczność funkcji - zero points of the function
Indicate which pairs of expressions or words are translated correctly.
wykres funkcji - graph of the function
dziedzina funkcji - domain of the function
asymptoty wykresu - asymptotes of the graph
zbiór wartości funkcji - set of values of the function
miejsce zerowe funkcji - monotonicity of the function
monotoniczność funkcji - zero points of the function
zadanie
Source: GroMar, licencja: CC BY 3.0.
R1Aqqd4DzBpnx1
Interaktywna gra, polegająca na łączeniu wyrazów w pary w ciągu jednej minuty. Czas zaczyna upływać wraz z rozpoczęciem gry. Jeden ruch to odkrywanie najpierw jednej potem drugiej karty z wyrazem. Każdy wyraz jest odczytywany. Kolejny ruch to odkrywanie trzeciej i czwartej karty. W ten sposób odsłuchasz wszystkie wyrazy. Nawigacja z poziomu klawiatury za pomocą strzałek, odsłuchiwanie wyrazów enterem lub spacją. Znajdź wszystkie pary wyrazów.
Interaktywna gra, polegająca na łączeniu wyrazów w pary w ciągu jednej minuty. Czas zaczyna upływać wraz z rozpoczęciem gry. Jeden ruch to odkrywanie najpierw jednej potem drugiej karty z wyrazem. Każdy wyraz jest odczytywany. Kolejny ruch to odkrywanie trzeciej i czwartej karty. W ten sposób odsłuchasz wszystkie wyrazy. Nawigacja z poziomu klawiatury za pomocą strzałek, odsłuchiwanie wyrazów enterem lub spacją. Znajdź wszystkie pary wyrazów.
Match Polish terms with their English equivalents.
wykres funkcji
set of values of the function
miejsce zerowe funkcji
asymptotes of the graph
zbiór wartości funkcji
zero points of the function
graph of the function
asymptoty wykresu
domain of the function
dziedzina funkcji
Source: Zespół autorski Politechniki Łódzkiej, licencja: CC BY 3.0.