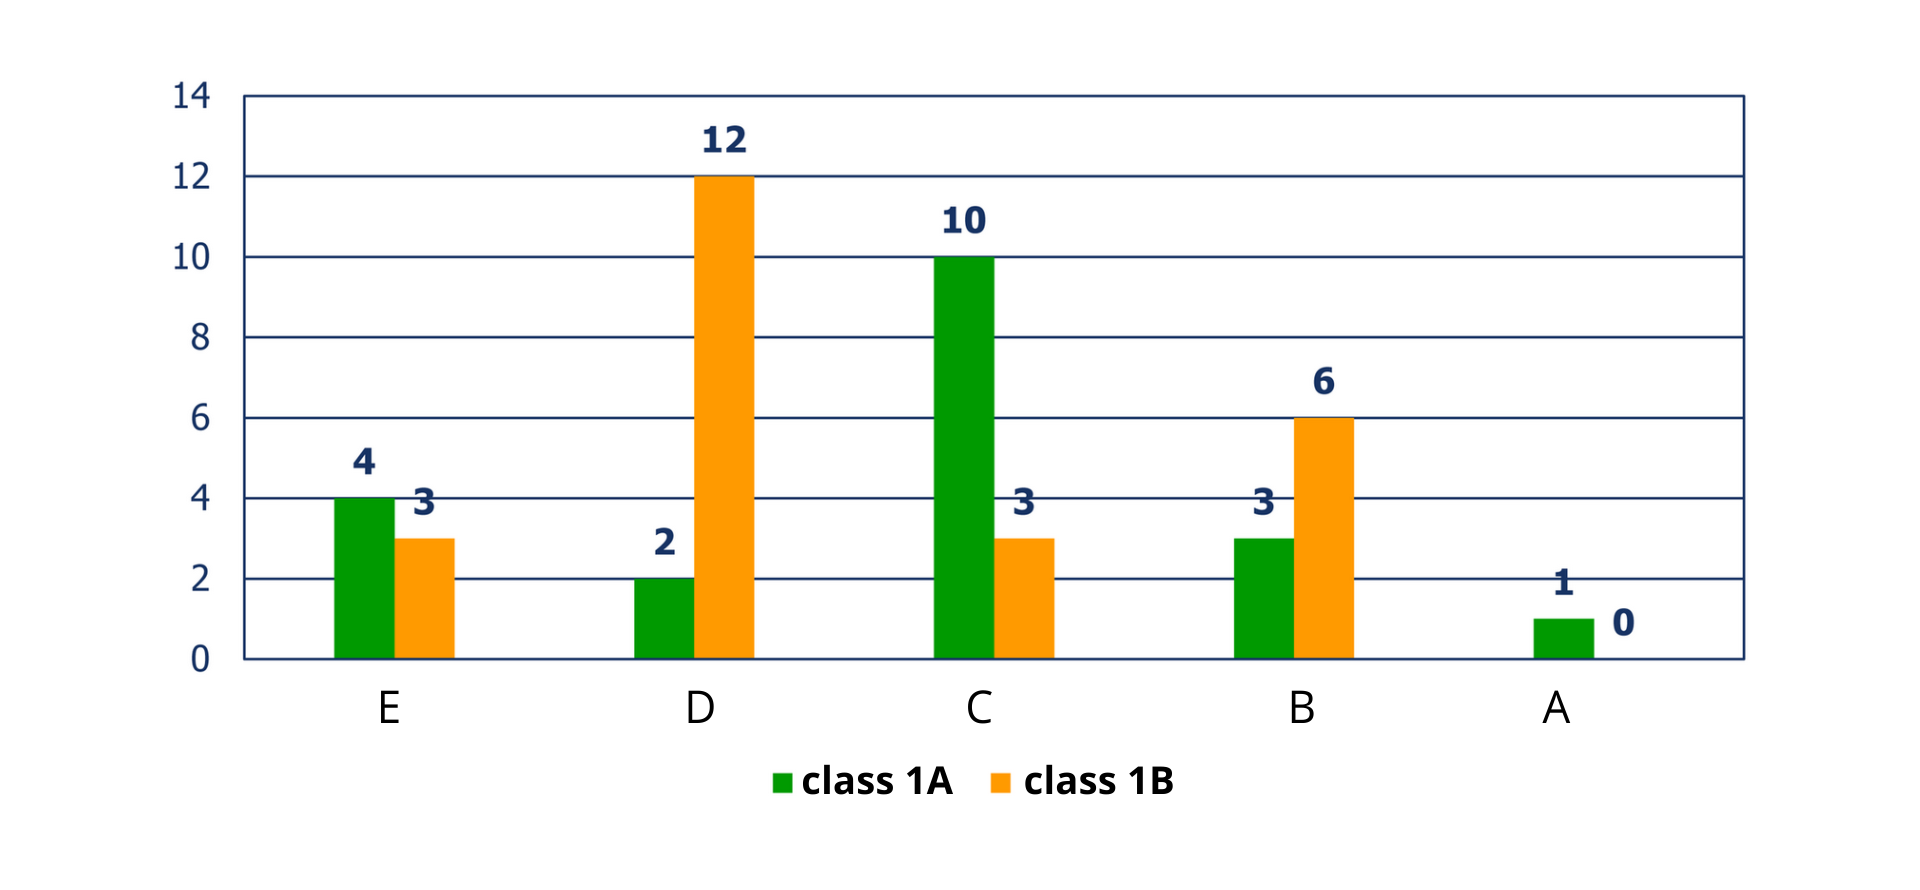
At the end of the schoolyear, students of classes 1A and 1B wrote a test from the Polish language. Results they obtained are presented in the bar chartbar chartbar chart.
R1IuSMdMKapc51
Ilustracja przedstawia diagram słupkowy. Na osi poziomej zaznaczono E, D, C, B i A, na osi pionowej 0, 2, 4, 6, 8, 10, 12, 14. Przy E słupek zielony wysokości 4 i słupek pomarańczowy wysokości 3. Przy D słupek zielony wysokości 2 i słupek pomarańczowy wysokości 12. Przy C słupek zielony wysokości 10 i słupek pomarańczowy wysokości 3. Przy B słupek zielony wysokości 3 i słupek pomarańczowy wysokości 6. Przy A słupek zielony wysokości 1 i słupek pomarańczowy wysokości 0. Pod diagramem legenda: zielony - class 1A, pomarańczowy - class 1B.
Observe how data presented in the bar chart can be presented using the percentage bar chartbar chartbar chart.
R1T3GBurpSv0j
Ilustracja interaktywna przedstawia dwa diagramy kołowe procentowe. Diagram po lewej oznaczony numerem pierwszym, opisany class 1A, podzielony na pomarańczowy - 20 procent, fioletowy - 10 procent, zielony - 50 procent, niebieski - 15 procent, granatowy - 5 procent. Diagram po prawej oznaczony numerem dwa, opisany class 1B, podzielony na pomarańczowy - 12,5 procent, fioletowy - 50 procent, zielony - 12,5 procent, niebieski - 25 procent, granatowy - 12,5 procent. Między diagramami legenda: pomarańczowy - E, fioletowy - D, zielony - C, niebieski - B, granatowy - A. Na ilustracji widoczne są numery, a na nich podpisy. 1. class A {audio}, 2. class B {audio}.
Ilustracja interaktywna przedstawia dwa diagramy kołowe procentowe. Diagram po lewej oznaczony numerem pierwszym, opisany class 1A, podzielony na pomarańczowy - 20 procent, fioletowy - 10 procent, zielony - 50 procent, niebieski - 15 procent, granatowy - 5 procent. Diagram po prawej oznaczony numerem dwa, opisany class 1B, podzielony na pomarańczowy - 12,5 procent, fioletowy - 50 procent, zielony - 12,5 procent, niebieski - 25 procent, granatowy - 12,5 procent. Między diagramami legenda: pomarańczowy - E, fioletowy - D, zielony - C, niebieski - B, granatowy - A. Na ilustracji widoczne są numery, a na nich podpisy. 1. class A {audio}, 2. class B {audio}.
The most common form of presenting statistical datastatistical datastatistical data is a tabletabletable.
Graphical presentation of statistical data is making various types of graphs.
A graph can be a vertical or horizontal bar chartbar chartbar chart, a percentage diagrampercentage diagrampercentage diagram, a pyramid of population, etc.
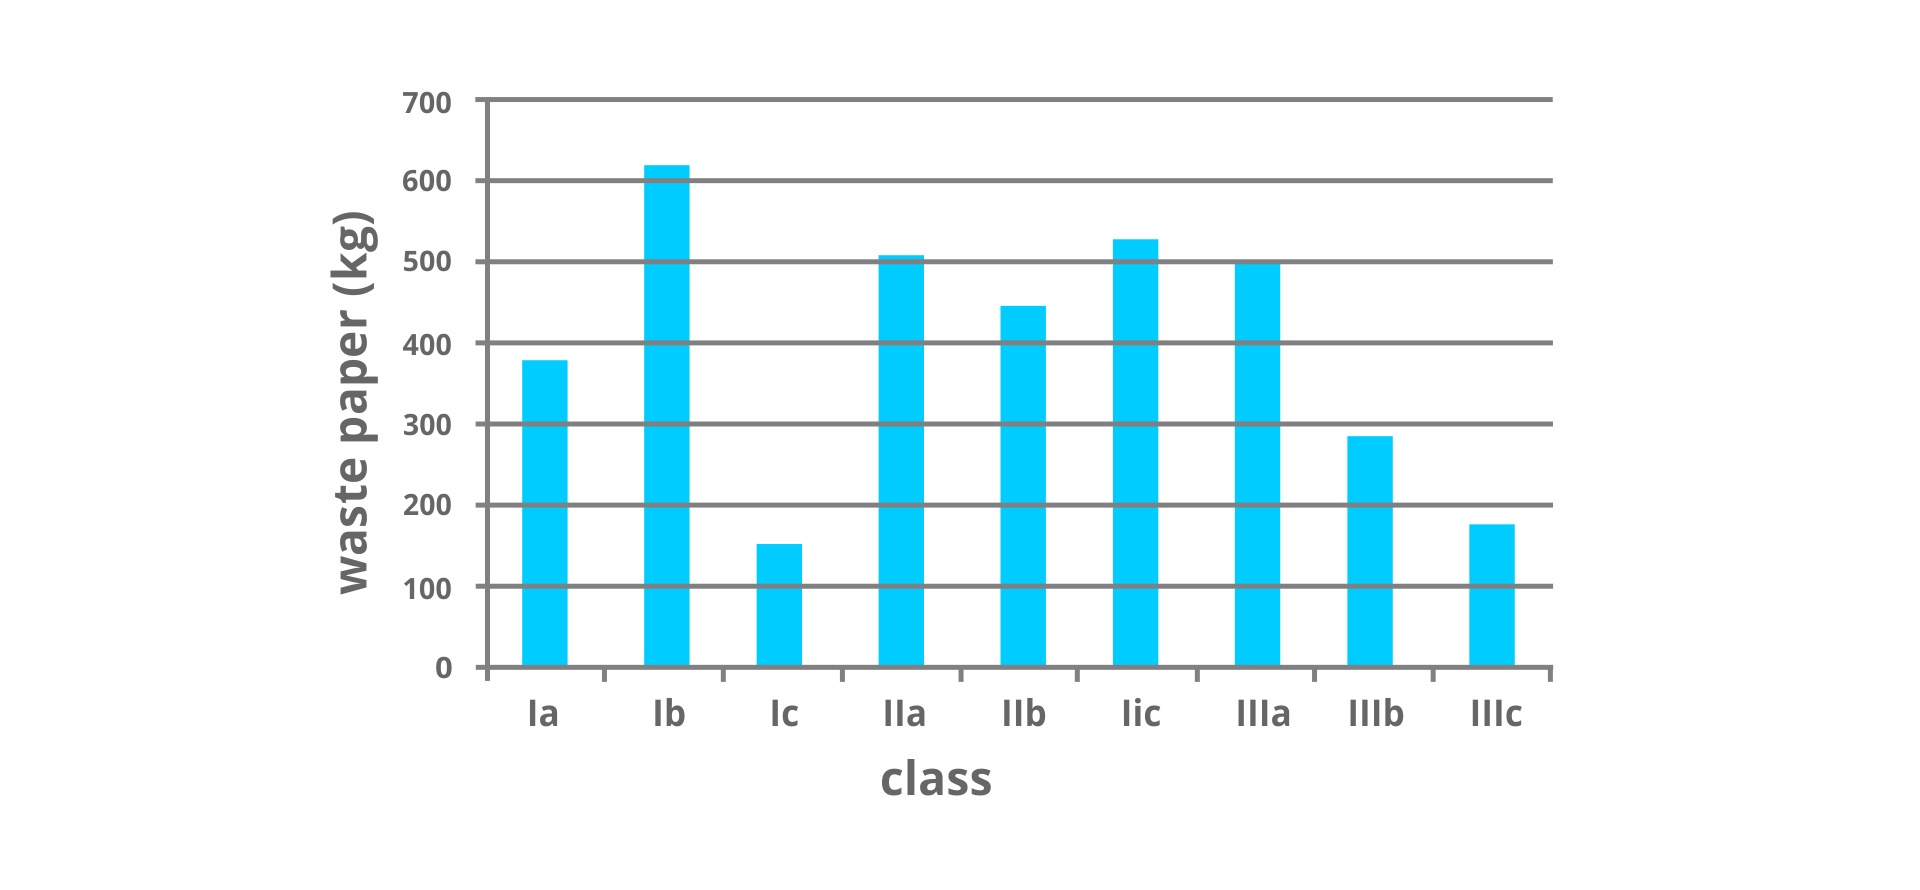
In the bar chart there are results of the waste paper collection in a school, in classes I – III.
ROVyTrpOlP8Ef1
Ilustracja przedstawia diagram słupkowy. Na osi poziomej opisanej class zaznaczono Ia, Ib, Ic, IIa, IIb, IIc, IIIa, IIIb, IIIc, na osi pionowej opisanej waste paper (kg) zaznaczono 0, 100, 200, 300, 400, 500, 600, 700. Przy Ia słupek wysokości około 380. Przy Ib słupek wysokości około 610. Przy Ic słupek wysokości około 150. Przy IIa słupek wysokości około 505. Przy IIb słupek wysokości około 440. Przy IIc słupek wysokości około 520. Przy IIIa słupek wysokości około 500. Przy IIIb słupek wysokości około 290. Przy IIIc słupek wysokości około 180.
Present the structure of gender and age of the Polish population this year using the pyramid of population. Look for necessary information in available knowledge sources.
Task 5
An extra task:
Look for information about presenting data in the form of a stem‑and‑leaf tabletabletable. Present information about the height of students from your class using this method.
The most common form of presenting statistical datastatistical datastatistical data is a tabletabletable.
Graphical presentation of statistical data is making various types of graphs.
A graph can be a vertical or horizontal bar chartbar chartbar chart, a percentage diagrampercentage diagrampercentage diagram, a pyramid of population, etc.
Exercises
Exercise 1
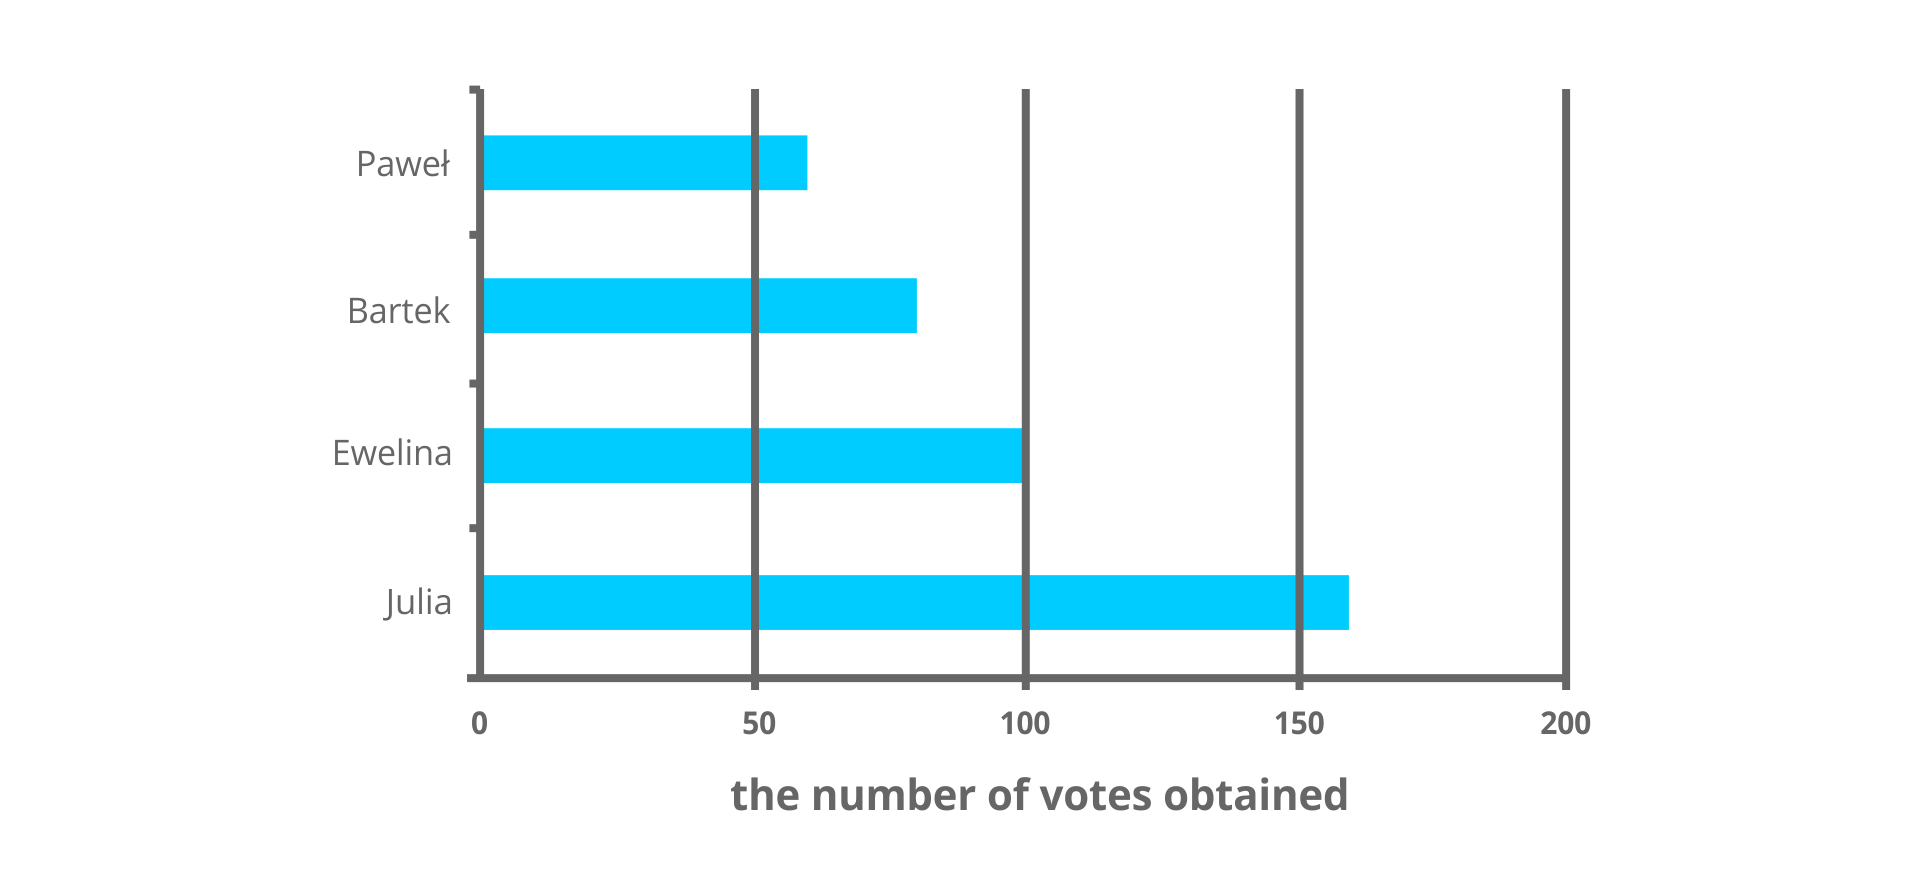
On the bar chart there are data about the election for a school president, in which 400 students voted.
RgjIL8CEO9HQE1
Ilustracja przedstawia diagram słupkowy poziomy. Na osi poziomej opisanej the number of votes obtained zaznaczono 0, 50, 100, 150, 200, na osi pionowej zaznaczono Julia - słupek długości około 160, Ewelina - słupek długości około 100, Bartek - słupek długości około 75, Paweł - słupek długości około 60.
Source: GroMar, licencja: CC BY 3.0.
RXAezjvJGCuyU
Wersja alternatywna ćwiczenia: Determine which sentences are true. Możliwe odpowiedzi: 1. Julia won the election for the school president., 2. Ewelina got a half of all votes., 3. Ewelina got a fourth of all votes., 4. Ewelina got twice as many votes as Paweł.
Wersja alternatywna ćwiczenia: Determine which sentences are true. Możliwe odpowiedzi: 1. Julia won the election for the school president., 2. Ewelina got a half of all votes., 3. Ewelina got a fourth of all votes., 4. Ewelina got twice as many votes as Paweł.
Determine which sentences are true.
Julia won the election for the school president.
Ewelina got a half of all votes.
Ewelina got a fourth of all votes.
Ewelina got twice as many votes as Paweł.
Exercise 2
Present information about landscape parks in Poland, using a line graph. Look for necessary information on the Internet.
Student's individual work.
Exercise 3
Schedules of buses on bus stops are usually presented in the form of a stem‑and‑leaf diagramstem‑and‑leaf diagramstem‑and‑leaf diagram. Look for information about any schedule of any bus on the internet. In English, present in what hours the bus goes most often and with what frequency.
Exercise 4
R156BFhpXwMVi
Wersja alternatywna ćwiczenia: Indicate which pairs of expressions or words are translated correctly. Możliwe odpowiedzi: 1. dane statystyczne - statistical data , 2. tabela - table, 3. diagram kołowy - pie chart, 4. diagram słupkowy - bar chart, 5. diagram procentowy - population pyramid, 6. tabela łodygowo-listkowa - percentage diagram
Wersja alternatywna ćwiczenia: Indicate which pairs of expressions or words are translated correctly. Możliwe odpowiedzi: 1. dane statystyczne - statistical data , 2. tabela - table, 3. diagram kołowy - pie chart, 4. diagram słupkowy - bar chart, 5. diagram procentowy - population pyramid, 6. tabela łodygowo-listkowa - percentage diagram
Indicate which pairs of expressions or words are translated correctly.
dane statystyczne - statistical data
tabela - table
diagram kołowy - pie chart
diagram słupkowy - bar chart
diagram procentowy - population pyramid
tabela łodygowo-listkowa - percentage diagram
zadanie
Source: GroMar, licencja: CC BY 3.0.
R1XsCVZmdf1mi1
Interaktywna gra, polegająca na łączeniu wyrazów w pary w ciągu jednej minuty. Czas zaczyna upływać wraz z rozpoczęciem gry. Jeden ruch to odkrywanie najpierw jednej potem drugiej karty z wyrazem. Każdy wyraz jest odczytywany. Kolejny ruch to odkrywanie trzeciej i czwartej karty. W ten sposób odsłuchasz wszystkie wyrazy. Nawigacja z poziomu klawiatury za pomocą strzałek, odsłuchiwanie wyrazów enterem lub spacją. Znajdź wszystkie pary wyrazów.
Interaktywna gra, polegająca na łączeniu wyrazów w pary w ciągu jednej minuty. Czas zaczyna upływać wraz z rozpoczęciem gry. Jeden ruch to odkrywanie najpierw jednej potem drugiej karty z wyrazem. Każdy wyraz jest odczytywany. Kolejny ruch to odkrywanie trzeciej i czwartej karty. W ten sposób odsłuchasz wszystkie wyrazy. Nawigacja z poziomu klawiatury za pomocą strzałek, odsłuchiwanie wyrazów enterem lub spacją. Znajdź wszystkie pary wyrazów.
Match Polish terms with their English equivalents.
diagram procentowy
statistical data
diagram słupkowy
pie chart
tabela
percentage diagram
dane statystyczne
bar chart
diagram kołowy
table
Source: Zespół autorski Politechniki Łódzkiej, licencja: CC BY 3.0.