Indicators of socio‑economic development
that the percentages of people employed in certain sections of the economy indicates the level of development of that country;
that on world maps dealing with socio‑economic phenomena, it is very common to give average values for the whole country for given indicators.
the parameters of quantitative and qualitative economic development, including: GDP, Brandt's Line, infant mortality, life satisfaction;
to discuss parameters of social development: HDI and what it consists of, the Gini coefficient
to indicate the countries of the world with the highest and lowest rates of socio‑economic development
the administration of social and natural factors that affect development
Gross Domestic Product (GDP) per head (per capita)
In assessing level of economic development, we usually use GDP per capita. Gross Domestic ProductGross Domestic Product is the value of goods and services produced in a country over the course of a year. It is not related to average wages or average income.
The value of this is quite east=y to determine in countries that operate according to the law, where precise figures, such as the size of the population, are kept. In many countries these are for a large part estimates. Also, there is no one method for calculation – for example, separate data is published by the US government, the World Bank and the International Monetary Fund.
In this table are presented ranges of GDP per capita (per head, according to purchasing power parity).
To compare GDP across countries, it has been used purchasing power parity. The purchasing power parity allows to solve the problem of international GDP comparisons. The key issue is to collect data on prices from the aggregated list of goods and services, which contains comparable and representative products for the analyzed countries. Purchasing power parity is a more appropriate indicator than the financial (exchange‑banking) exchange rate, because it takes into account the purchasing power of the population.
Country | GDP per capita (USD) | Country | GDP per capita (USD) | Country | GDP per capita (USD) |
Qatar | 102100 | Japan | 37100 | Togo | 1100 |
Liechtenstein | 89400 | Slovenia | 27400 | Madagascar | 1000 |
Luxembourg | 77900 | Poland | 21100 | Malawi | 900 |
Singapore | 62400 | Romania | 13200 | Niger | 800 |
Norway | 55400 | El Salvador | 7500 | Liberia | 700 |
Brunei | 54800 | Egypt | 6600 | Central African Republic | 700 |
United States | 52800 | Bolivia | 5500 | Burundi | 600 |
Switzerland | 46000 | India | 4000 | Zimbabwe | 600 |
Canada | 43100 | Pakistan | 3100 | Somalia | 600 |
Australia | 43000 | Tajikistan | 2300 | Democratic Republic of Congo | 400 |
Given the wide spread of figures, it is not difficult to distinguish highly developed and underdeveloped countries. The vast majority of countries fall in the middle. The question of which values should be used to separate highly developed countries from the middle group will always be open to debate.
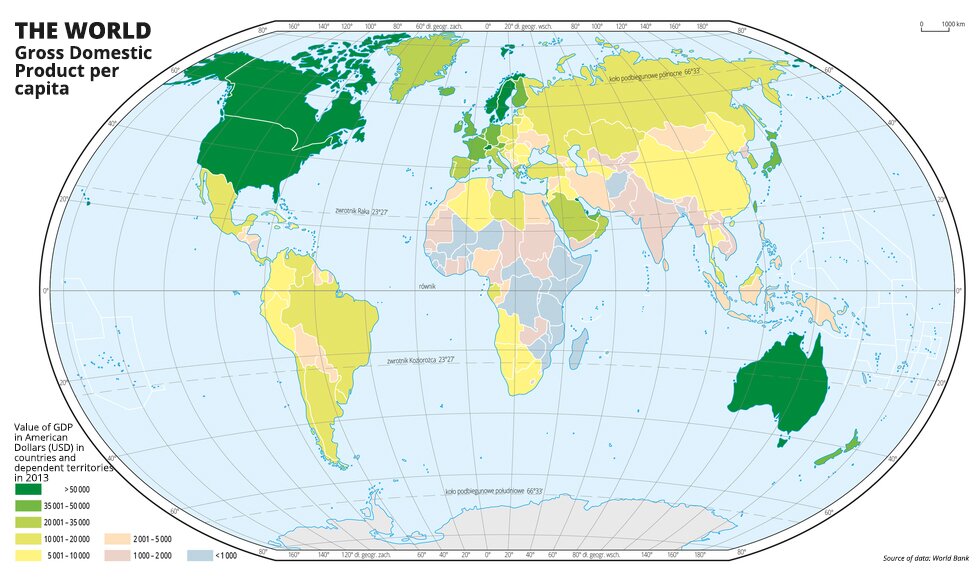
It is easy to see that the countries with the highest GDP per capita are located in North America, Europe, the south of the Persian Gulf and in Australia. In turn, the lowest figures are prevalent in south‑Saharan Africa, South Asia and South‑East Asia. This differntiation has provided the basis for the distinction between the so‑called rich North and the poor South. The line of division is known as the Brandt Line.

Indicators of quality
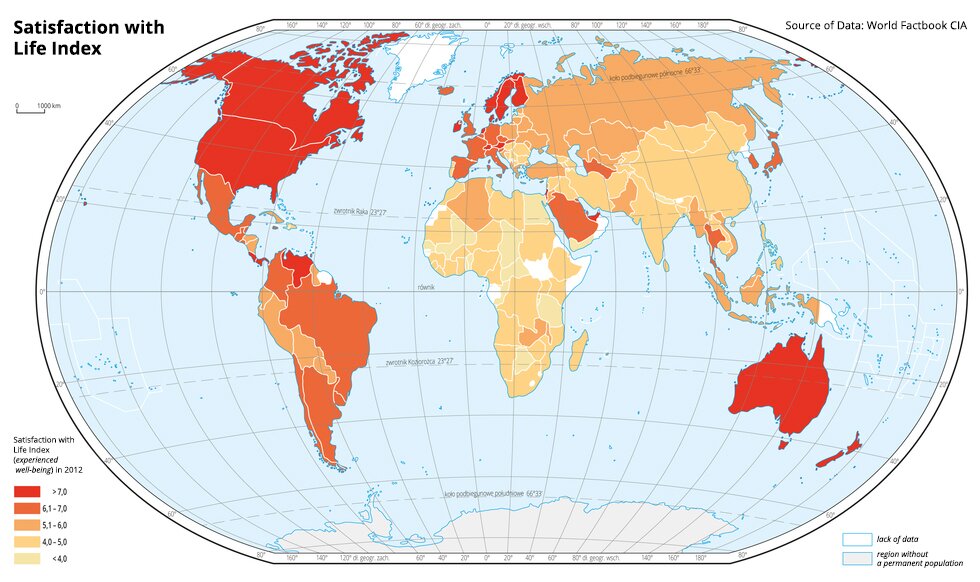
In addition to the quantitative indicators for analysis of the socio‑economic situation of a place, we also use qualitative indicators. They are most often used to examine or analyse some „unmeasurable”. Each individual has their own criteria to assess their quality of life. These assessments, particularly when combined, are not objective, so cannot be verified. One of these is the Satisfaction of Life Index.
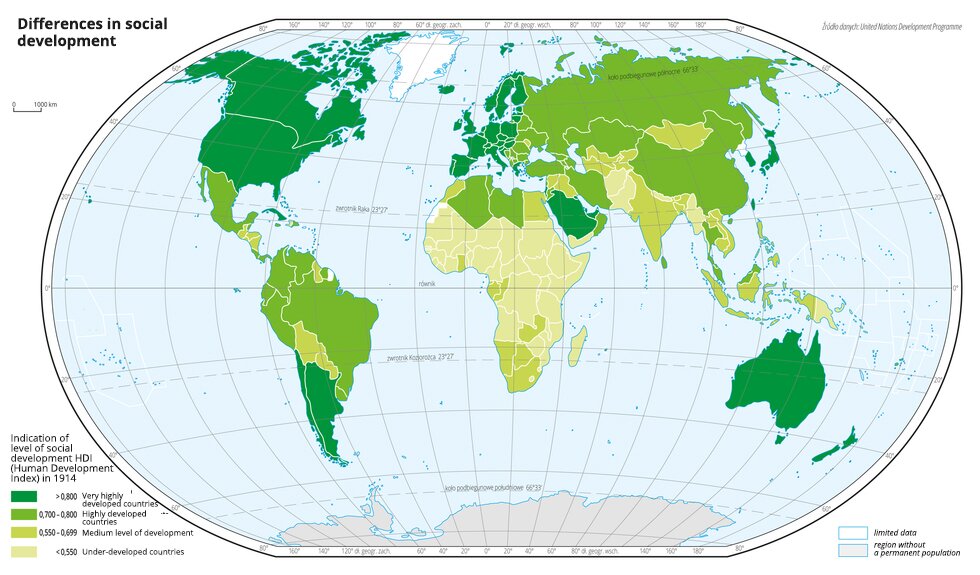
HDI social development index
There are many indicators for levels of development, such as energy consumption per capita, expenditure on research and development, level of education attained and comparison between male and female earnings. However, each of these only shows part of the overall reality. That is why the UN Development Agenda publishes an annual composite index – **the social development index **(eng. Human Development Index – HDI).
Three indicators are analysed: gross national income per head, according to purchasing power paritypurchasing power parity, life expectancy and average number of years spent in education for adults (people age 25 and over) and expected number of years to be spent in education for children of school age. For each part, the highest value is 1 and the lowest is 0. Based on this, values for each country are worked out, and a synthetic result is calculated by taking the geometric mean.
Countries whose figure is at least 0.710 are considered to be highly developed, and those below 0.536 to be underdeveloped. In 2012 the world average was 0.694 and Norway, with 0.955, achieved the highest score. THe lowest was Niger – 0.304.
Metrics and criteria
We should bear in mind that not all indicators that are helpful in describing socio‑economic development are consistent in any given country.
Information about development is added to by data on diversity within countries. These are described using the Gini coefficient (Social Inequality Index) – the higher the score in a given country, the greater the level of social disparity.
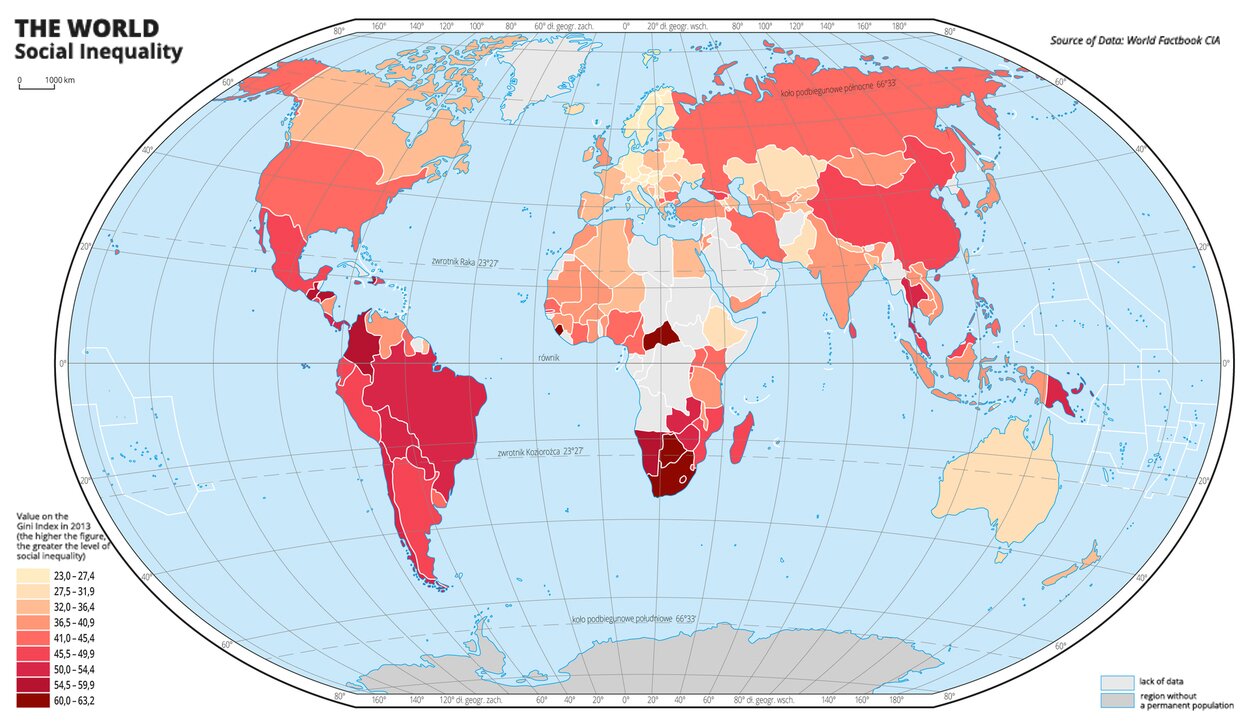
The map shows that there are smaller social inequalities in highly developed countries. In countries with less significant differences, development is faster.
Identify natural and non-natural factors which can affect social development.

Mark the countries with the highest HDI index in green, countries with the medium HDI index in yellow and those with the lowest HDI index in red.
{green}Norway{/green} {green}Japan{/green} {red}Chad{/red} {yellow}Turkey{/yellow} {green}Croatia{/green} {red}Yemen{/red} {green}Iceland{/green} {red}Ethiopia{/red} {green}Great Britain{/green} {green}UAE{/green} {green}Saudi Arabia{/green} {green}Argentina{/green} {green}Poland{/green} {green}Slovenia{/green} {yellow}Kazakhstan{/yellow} {green}Canada{/green} {green}USA{/green} {green}Australia{/green} {red}Honduras{/red} {yellow}Libya{/yellow} {red}Pakistan{/red} {red}Afghanistan{/red} {red}Niger{/red} {yellow}Brazil{/yellow} {yellow}Mexico{/yellow}
Put the countries in order according to the life satisfaction index. Start with the state with the highest satisfaction rate
- China
- Egypt
- Poland
- Sweden
Select three countries with the highest rates of infant mortality in the world.
- Afghanistan
- Chad
- Angola
- Mongolia
- Pakistan
- Peru
Looking at the picture, indicate the country which has one of the world's lowest GDP per capita and the highest infant mortality rates, which is as high as 6990 persons per doctor.
- Mongolia
- Pakistan
- Afghanistan
- RSA

Put the countries in order according to GDP per capita. Start with the country with the highest GDP per capita.
- Italy
- United States
- Belarus
- Germany
- Poland
Looking at the photo, indicate which country has one of the highest levels of GDP (per capita) in the world.
- United States
- Norway
- France
- Saudi Arabia

Indicate the countries on the map with the highest infant mortality rates.
Central African Republic, Chad, Mali, Niger, Angola, Somalia, Burkina Faso

Summary
Many criteria are used to describe development: quantitative, eg GDP per capita, qualitative, eg satisfaction of life index, complex, eg social development indexes (HDI)
The prevailing level of development is a result of the combined impact of natural and socio‑economic factors.
Keywords
GDP, gross domestic product, Gini coefficient, HDI, Brandt's line
Glossary
parytet siły badawczej - wskaźnik pozwalający na porównanie rzeczywistej siły nabywczej, czyli ile standardowych dóbr można nabyć w przeliczeniu na wybraną walutę, najczęściej dolary amerykańskie
produkt krajowy brutto - wartość produktów i usług wytworzonych w państwie w ciągu roku
współczynnik Gini - stosowana w statystyce miara koncentracji (nierównomierności) rozkładu zmiennej losowej. Nazwa współczynnika pochodzi od nazwiska jego twórcy, włoskiego statystyka Corrado Giniego.