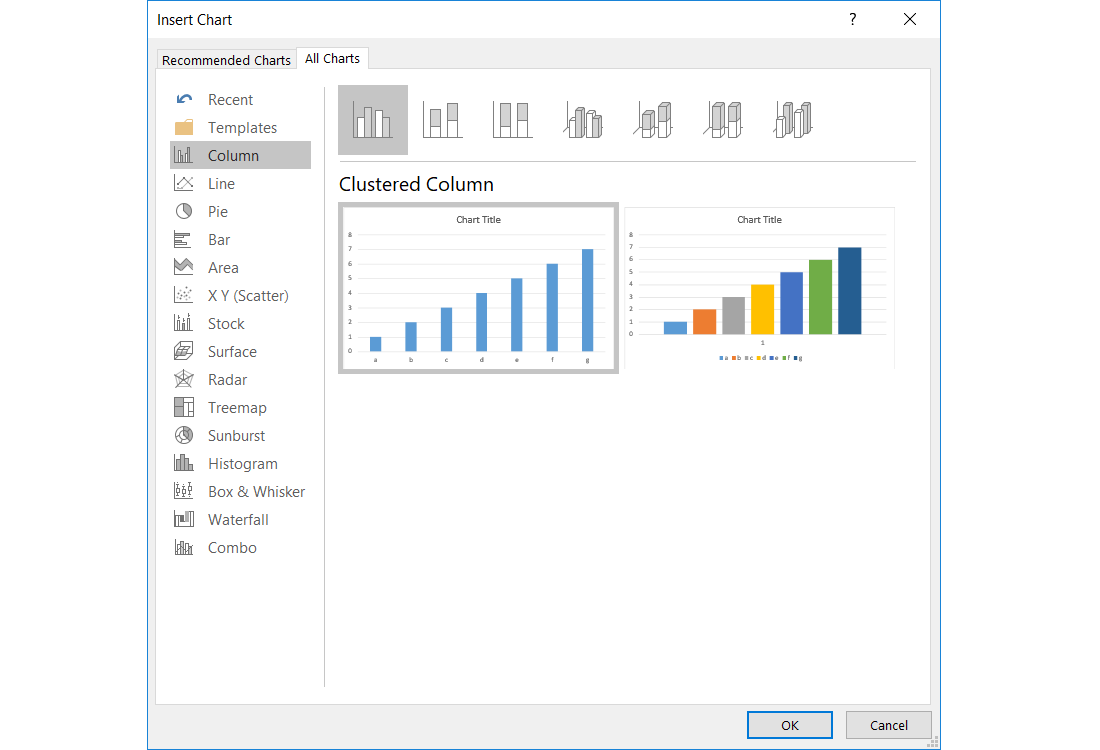
Should the chart type be adjusted to the presented data?
Rl0S2MIi76Qjf1
Zrzut ekranu przedstawia formatkę dodawania wykresy w MS Excel. Po lewej stronie lista dostępnych typów wykresów: Column, Line, Pie, Bar, Area, XY (Scater), Stock, Surface, Radar, Treemap, Sunburst, Histogram, Box & Whisker, Waterfall. Combo. Po prawej podgląd wybranego typu w przykładzie dwa wykresy kolumnowe.
A data seriesdata seriesdata series is a rowrowrow or columncolumn column of numbers that are entered in a worksheet and represented in a chart. It is very often the case that after creating the chartchartchart, you might need to modify it so that it includes another added data series.
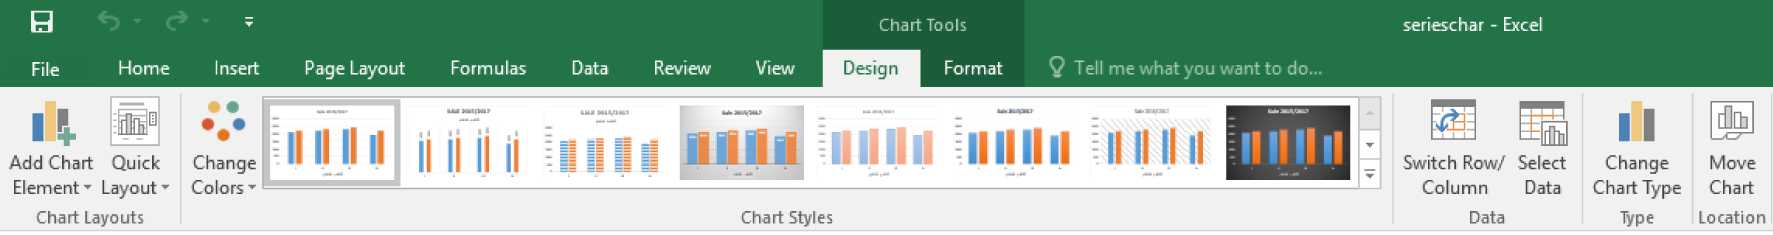
A chart created in Excel is always based on a certain range of datarange of datarange of data which was selected in a worksheet before creating the chart. Thus already during creating the chart you can decide which data will be plotted in it. If you want to modify the range of data after creating the chart, use the option Select Data, which you can find on the Design tab under Chart Tools or on the pop‑up menu. In the Select Data Sourcedata sourceData Source dialogue box, which appears on the worksheet, you can edit the data series which are used for creating the chart.
R1IUo7ATa9a8a
Zrzut z ekranu przedstawia zakładkę Design w Chart Tools w programie MS Excel. Od lewej strony Grupa Chart Layouts, a w niej menu: Add Chart Elements, Quick Layout. Następnie grupa Chart Styles, a w niej menu Change Colors (obok podgląd wykresów). Dalej grupa Data, a w niej menu: Switch Row/Column oraz Select Data. Następnie Grupa Type z menu Change Chart Type oraz grupa Location z menu Move Chart.
The Design tab
Source: GroMar, licencja: CC BY 3.0.
RHWWc2BhWTybI
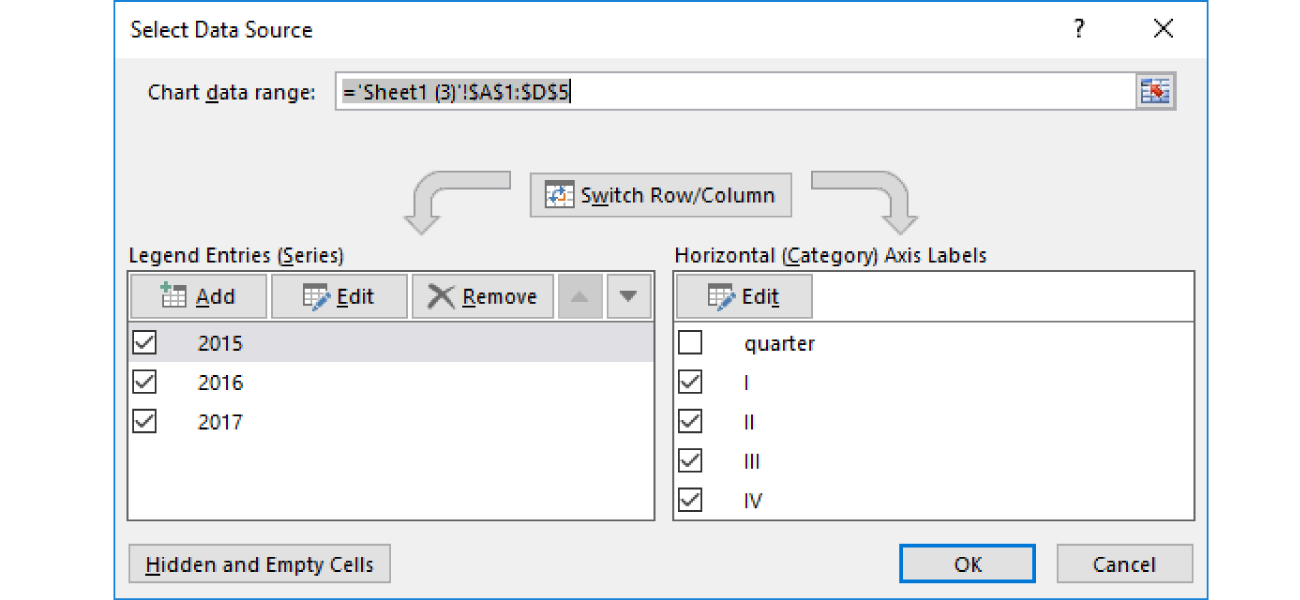
Zrzut ekranu przedstawia formatkę umożliwiającą wybieranie źródła danych do wykresu. Tytuł formatki: Select Data Source. Na górze napis Chart data range, obok pole tekstowe z wpisanym zakresem rozpoczynającym się znakiem równości, i dalej: apostrof, Sheet w nawiasie okrągłym cyfra 3, apostrof wykrzyknik, znak dolara, A znak dolara, 1, dwukropek znak dolara, D znak dolara, 5. Poniżej przycisk z napisem Switch Row/Column, od niego odchodzą dwie strzałki. Lewa strzałka wskazuje tabelę Legend Entries (Series). W nagłówku znajdują się przyciski: Add, Edit, Remove. Tabela zawiera przykładowe dane (2015, 2016, 2017), przy każdej danej znajduje się checkbox. Prawa tabela: Horizontal (Category) Axis Labels w nagłówku ma przycisk Edit. Zawiera przykładowe dane (quartet, jedynka zapisana w systemie rzymskim, dwójka zapisana w systemie rzymskim, trójka zapisana w systemie rzymskim, czwórka zapisana w systemie rzymskim), obok których znajdują się checkboxy. Na dole formatki znajdują się trzy przyciski. Z lewej strony Hidden and Empty Cells. Z prawej obok siebie OK i Cancel.
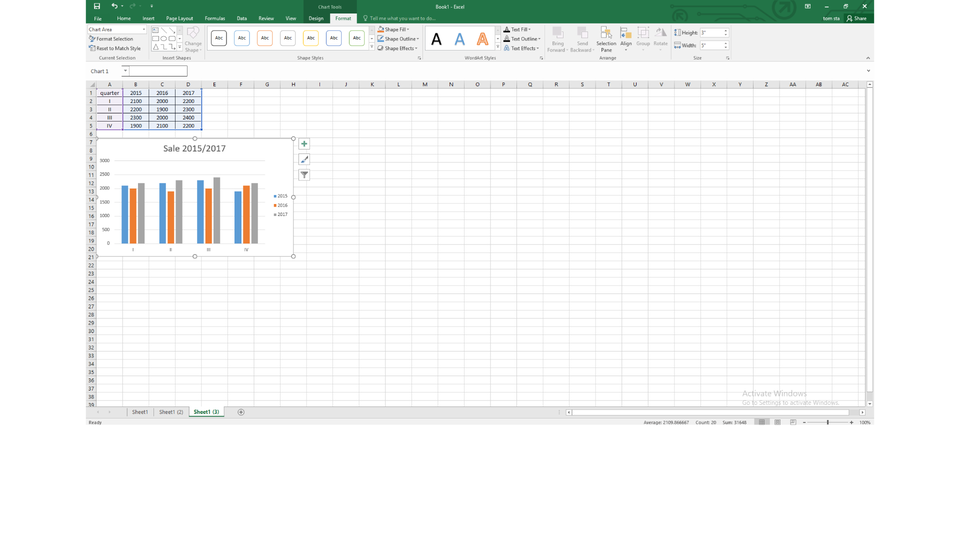
If your chartchartchart is on the same worksheet as the data you used to create it, the two quick methods of adding a data seriesdata seriesdata series to a chart are available:
After selecting a chart, the source data are selected on the worksheet as areasareasareas with sizing handleshandleshandles shown. Drag the sizing handles to include the new data.
Select the cells with the data series you want to include in your chart, copy it to the clipboard, select the chart and paste the data.
RU3L171apRBdj
Pokaz slajdów - Tworzenie wykresu na podstawie kilku serii danych. Instrukcja obsługi z poziomu klawiatury: 1. Uruchomienie aplikacji - ENTER, 2. Na każdym ze slajdów czytany jest automatycznie tekst alternatywny po polsku, 3. Przy pierwszym uruchomieniu na pierwszym slajdzie, czytanie tekstu po angielsku - TAB, 4. Przejście między slajdami: do następnego slajdu - TAB, do poprzedniego slajdu - TAB + SHIFT, 5. Przejście do czytania napisu po angielsku - strzałka w górę + strzałka w dół (czyta tekst po angielsku widoczny na slajdzie).
Pokaz slajdów - Tworzenie wykresu na podstawie kilku serii danych. Instrukcja obsługi z poziomu klawiatury: 1. Uruchomienie aplikacji - ENTER, 2. Na każdym ze slajdów czytany jest automatycznie tekst alternatywny po polsku, 3. Przy pierwszym uruchomieniu na pierwszym slajdzie, czytanie tekstu po angielsku - TAB, 4. Przejście między slajdami: do następnego slajdu - TAB, do poprzedniego slajdu - TAB + SHIFT, 5. Przejście do czytania napisu po angielsku - strzałka w górę + strzałka w dół (czyta tekst po angielsku widoczny na slajdzie).
On the Internet, find the data presenting the average daily temperatures and precipitation for Suwałki and Tarnów in every month of the last year. Create a table in a spreadsheet in which you will enter the data. For each city calculate the average yearly temperature and the sum of yearly precipitation. Create charts that compare the temperature and precipitation in both cities. Select chartchartchart types so that the charts are the most readable in your opinion. By using a combo chart, include the data related to the temperature and precipitation in one chart.
Presenting data, numbers, forecasts or trends in the form of charts makes them easy to understand by an audience.
Exercises
Exercise 1
R1DQi4b7sPas5
Wersja alternatywna ćwiczenia: Determine which sentences are true. Możliwe odpowiedzi: 1. A data series is a row or column of numbers that are entered in a worksheet and represented in a chart. , 2. A chart created in a spreadsheet is always based on a certain range of data which was selected in a worksheet before creating the chart., 3. After creating a chart, you can add another data series to it. , 4. You can create a chart in a spreadsheet without specifying the range of data. , 5. You cannot modify the values in a table on which a chart is based.
Wersja alternatywna ćwiczenia: Determine which sentences are true. Możliwe odpowiedzi: 1. A data series is a row or column of numbers that are entered in a worksheet and represented in a chart. , 2. A chart created in a spreadsheet is always based on a certain range of data which was selected in a worksheet before creating the chart., 3. After creating a chart, you can add another data series to it. , 4. You can create a chart in a spreadsheet without specifying the range of data. , 5. You cannot modify the values in a table on which a chart is based.
Determine which sentences are true.
A data series is a row or column of numbers that are entered in a worksheet and represented in a chart.
A chart created in a spreadsheet is always based on a certain range of data which was selected in a worksheet before creating the chart.
After creating a chart, you can add another data series to it.
You can create a chart in a spreadsheet without specifying the range of data.
You cannot modify the values in a table on which a chart is based.
zadanie
Source: GroMar, licencja: CC BY 3.0.
Exercise 2
On the internet, find the information about the population of any three cities, e.g. Gdańsk, Kraków and Łódź, in the last 20 years. Create a table in a spreadsheet in which you will enter the data. Select a chart type that will present the changes in the population the best.
Exercise 3
Describe in English creating a combo chart step by step.
Exercise 4
RHZZS3EcufZwv
Wersja alternatywna ćwiczenia: Indicate which pairs of expressions or words are translated correctly. Możliwe odpowiedzi: 1. seria danych - data series, 2. zakres danych - range of data, 3. źródło danych - data source, 4. wykres - chart, 5. uchwyty - areas, 6. obszary - handles
Wersja alternatywna ćwiczenia: Indicate which pairs of expressions or words are translated correctly. Możliwe odpowiedzi: 1. seria danych - data series, 2. zakres danych - range of data, 3. źródło danych - data source, 4. wykres - chart, 5. uchwyty - areas, 6. obszary - handles
Indicate which pairs of expressions or words are translated correctly.
seria danych - data series
zakres danych - range of data
źródło danych - data source
wykres - chart
uchwyty - areas
obszary - handles
zadanie
Source: GroMar, licencja: CC BY 3.0.
RKXbzbHf26Ny81
Interaktywna gra, polegająca na łączeniu wyrazów w pary w ciągu jednej minuty. Czas zaczyna upływać wraz z rozpoczęciem gry. Jeden ruch to odkrywanie najpierw jednej potem drugiej karty z wyrazem. Każdy wyraz jest odczytywany. Kolejny ruch to odkrywanie trzeciej i czwartej karty. W ten sposób odsłuchasz wszystkie wyrazy. Nawigacja z poziomu klawiatury za pomocą strzałek, odsłuchiwanie wyrazów enterem lub spacją. Znajdź wszystkie pary wyrazów.
Interaktywna gra, polegająca na łączeniu wyrazów w pary w ciągu jednej minuty. Czas zaczyna upływać wraz z rozpoczęciem gry. Jeden ruch to odkrywanie najpierw jednej potem drugiej karty z wyrazem. Każdy wyraz jest odczytywany. Kolejny ruch to odkrywanie trzeciej i czwartej karty. W ten sposób odsłuchasz wszystkie wyrazy. Nawigacja z poziomu klawiatury za pomocą strzałek, odsłuchiwanie wyrazów enterem lub spacją. Znajdź wszystkie pary wyrazów.
Match Polish terms with their English equivalents.
źródło danych
range of data
obszary
data source
chart
areas
wykres
data series
seria danych
zakres danych
Source: Zespół autorski Politechniki Łódzkiej, licencja: CC BY 3.0.