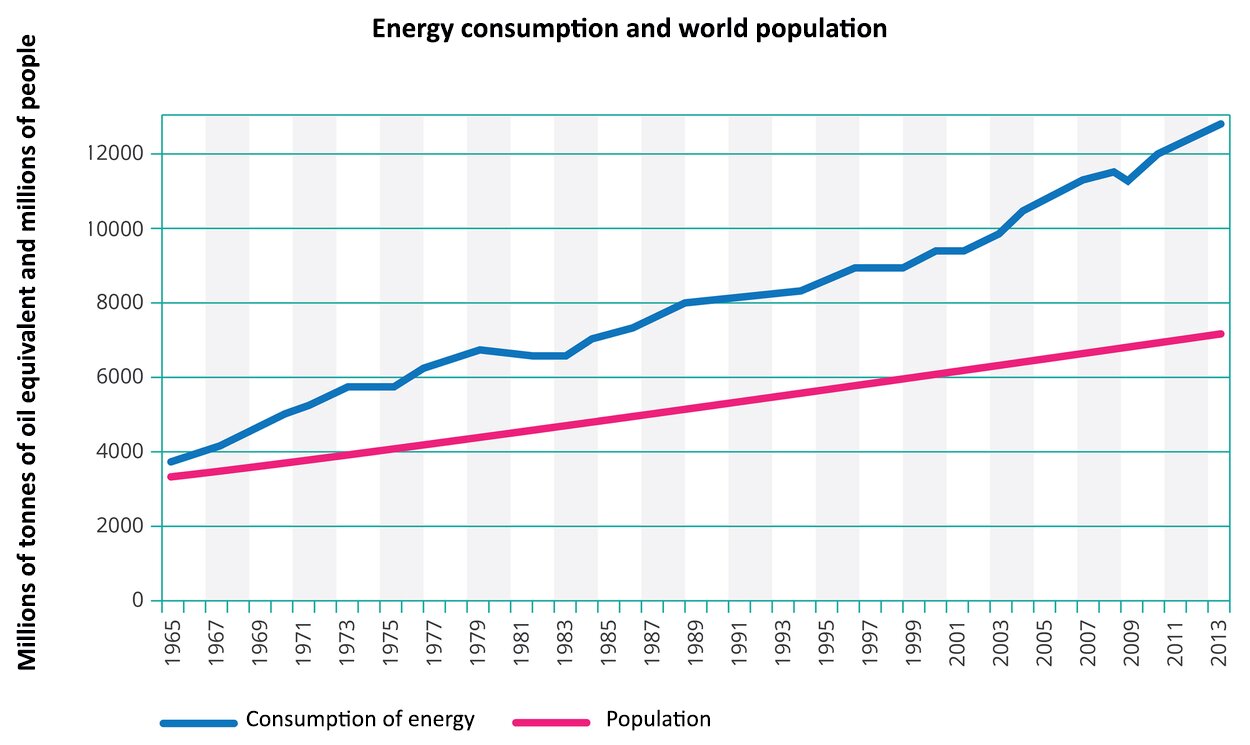
We need more and more energy not only because the number of people in the world is constantly growing. The technologies we use, the new inventions, the measures aimed at making life easier, etc., require more energy, even if they are becoming less energy‑consuming. Energy consumption around the world is growing faster than population. The rapid growth of energy consumption is particularly evident in developing countries where economic development is accompanied by rapid population growth and economic progress.
RzLDPpVcjgq58
Na ilustracji wykres liniowy konsumpcji energetycznej i światowej populacji, Energy consumption and world population. Z lewej strony na osi pionowej Y opisano wartości od zera do dwunastu tysięcy (miliony ton ekwiwalentu ropy naftowej i miliony osób, millions of tonnes of oil equivalent and millions of people). Na osi poziomej X opisano lata od tysiąc dziewięćset sześćdziesiąt pięć do dwa tysiące trzynaście. Liniami przedstawiono zużycie energii, consumption of energy – linia umieszczona wyżej, krzywa rosnąca od 3900 do powyżej 1200; oraz liczbę ludności na świecie, population - linia poniżej, prosta, rosnąca od 3800 do 7600. Ogólna tendencja rosnąca, zużycie energii rośnie zdecydowanie szybciej niż liczba ludności.
Energy consumption and world population
Source: Dariusz Adryan, licencja: CC BY 3.0.
Most natural resources are not distributed evenly across the Earth. This is also the case with energy raw materials. Therefore, there is a disproportion between the volume of energy production and energy consumption between continents.
R1DXwflKTDOIR
Na ilustracji wykres punktowy udziału kontynentów w produkcji i zużyciu energii, Share of continents in energy production and consumption (%). Z lewej strony na osi pionowej Y opisano wartości od zera do czterdziestu pięciu (konsumpcja, consumption). Na osi poziomej X opisano wartości od zera do czterdziestu pięciu (produkcja, production). Punkty umieszczone w różnych miejscach wykresu, rozrzucone. Azja [konsumpcja: około 40 %, produkcja około 40%], Ameryka Północna [konsumpcja: około 18%, produkcja” około 16%], Europa [produkcja: około 7%, konsumpcja około: 8%], Ameryka Łacińska [konsumpcja około: 6%, produkcja: około 7%], Afryka [konsumpcja około: 5%, produkcja około: 9%], Państwa Pacyfiku [konsumpcja około: 1%, produkcja około 3%].
Share of continents in energy production and consumption (%)
Source: Dariusz Adryan, licencja: CC BY 3.0.
North America has a similar proportion in both production and consumption. Asia and Europe consume more energy than they are able to produce themselves. In turn, Africa, countries (mainly Russia) and Pacific countries with Australia at the forefront produce more energy than they consume.
If the difference between the amount of energy used and the amount of energy produced is positive, it means that the region is dependent on the supply of energy raw materials. This is the case, for example, in Europe, which produces 8% of the world's energy but consumes almost twice as much –14%.j energii, ale zużywa niemal dwa razy więcej – 14%.
Changes in the structure of energy production
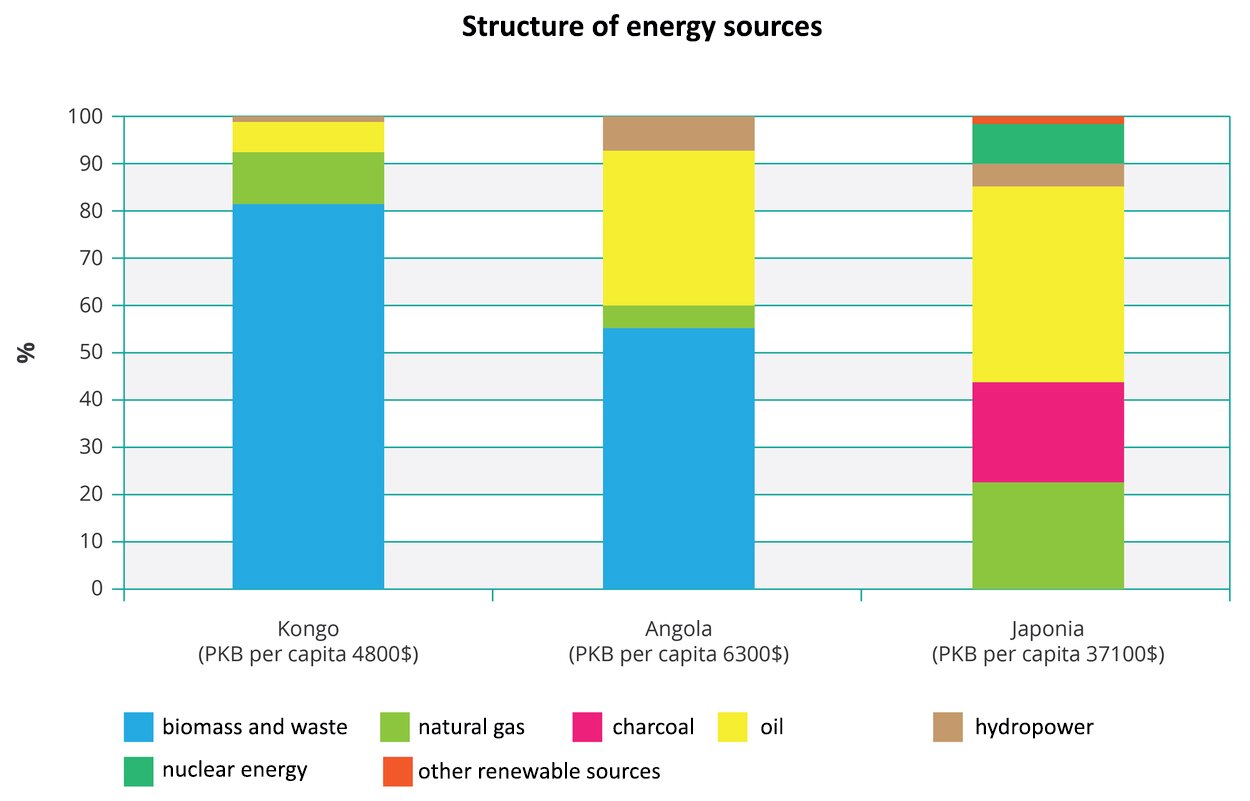
Between 1990 and 2010 the share of non‑renewable energy sources in the world energy sector almost did not change and amounted to about 84%. By 2040 their share is expected to decrease, but it will still be over 75%.
This is due, among other things, to the fact that the structure of energy production is changing as the economy develops: fossil fuels are becoming less and less important.
R1Y4eC8NEHRQE
Na ilustracji wykres słupkowy struktury źródeł energii, structure of energy sources. Trzy słupki, mocno zróżnicowane pod względem proporcji. Z lewej strony na osi pionowej opisano wartości od zera do stu w procentach. Na osi poziomej podpisano trzy słupki nazwami państw: Kongo (PKB na osobę 4800$), Angola (PKB na osobę 6300$), Japonia (PKB na osobę 37100$). Na słupkach oznaczono różnorodne źródła energii: biomasa i odpady; energia nuklearna; gaz ziemny; inne odnawialne; węgiel; ropa naftowa; hydroenergetyka. W krajach rozwijających się dominuje biomasa i odpady – w Kongo ponad 80%, w Angoli ponad 50%, ropa naftowa też stanowi znaczące źródło – ponad 30%. W Japonii ok. 50% stanowi ropa naftowa, ponad 20% gaz ziemny, ok. 20% węgiel kamienny i mniej niż 10% energia nuklearna.
Structure of energy sources. Analysis of developing countries such as Congo, Angola, and highly developed - Japan. Data from 2014.
Source: Dariusz Adryan, licencja: CC BY 3.0.
Consequences of being dependent on fossil fuels
Dependence on fossil fuels has many consequences. In the case of coal mines, mine dumps are created and galleries collapse which causes land subsidence. Removal of mine water lowers the level of groundwaters and creates cones of depression. The extracted raw materials have to be transported, so railway lines, roads and pipelines are being built. The effects of combustion include dust, sulphur oxides that cause acid rain, carbon dioxide that (according to many opinions) increases the greenhouse effect and the acidification of the oceans.
The income for exporters is an economic consequence. This is particularly important in the case of developing countries that possess energy resources, and that usually do not have many other more profitable opportunities to obtain a foreign currency for which they can buy the necessary goods.
Country
Ratio of the energy from import to the energy produced from domestic sources
Country
Ratio of the energy from import to the energy produced from domestic sources
Japan
17,7
United Arab Emirates
0,3
Taiwan
8,6
Algieria
0,3
South Korea
5,4
Saudi Arabia
0,3
Italy
5,0
Colombia
0,3
Portugal
4,7
Kuwait
0,2
Belgium
4,1
Norway
0,2
Task 1
Explain what oil is and where it is used. Search for areas with the largest oil reserves and specify the percentage of the world's oil reserves held by regions or countries. You can use different sources of information.
R145LCBhdZ7tr
Wykonaj zadanie zgodnie z poleceniem.
Wykonaj zadanie zgodnie z poleceniem.
Task 2
Explain the role of OPEC (Organisation of the Petroleum Exporting Countries) and name its member countries.
RkdKU4Q1ByeQZ
Wykonaj zadanie zgodnie z poleceniem.
Wykonaj zadanie zgodnie z poleceniem.
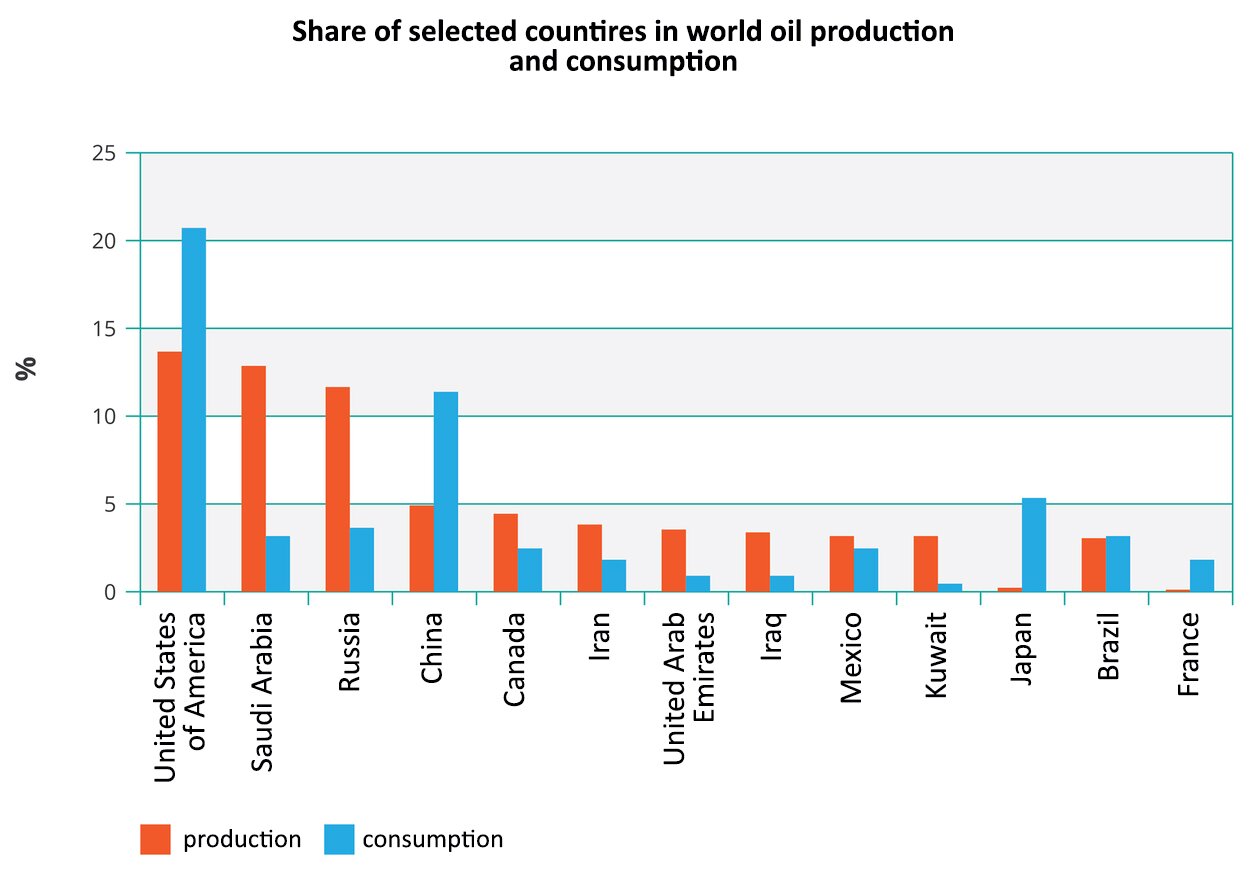
Another example of the political importance of oil is the Organisation of the Petroleum Exporting Countries (OPEC)OPEC(OPEC). It consists of 12 countries, mainly from the Middle East, but also from Africa and South America. As they extract together approx. 40% of the world's oil and make decisions on the volume of production, they determine the price of oil on the global market. This in turn affects the costs of transporting and producing many goods, e.g. fuels, plastics, paints, plant protection products. Manufacturing and delivery costs determine the prices of products, and thus the sales volume. Even the impact of oil prices on interest rates has been observed. It can be concluded that oil prices have a great impact on economic growth.
R12nrSbUt9pcc
Na ilustracji wykres słupkowy udziału wybranych krajów w światowej produkcji i konsumpcji oleju, Share of selected countries in world oil production and consumption. Z lewej strony na osi pionowej opisano wartości od zera do dwudziestu pięciu w procentach. Na osi poziomej podpisano nazwami państw trzynaście par słupków. Jedne z nich oznaczają produkcję ropy naftowej, a drugie konsumpcję ropy naftowej. Słupki są zróżnicowanej wielkości. Największe – Stany Zjednoczone (produkcja 13%, konsumpcja 21%) i Arabia Saudyjska (produkcja 12%, konsumpcja 4%), najmniejsze – Francja (produkcja 0,25%, konsumpcja 3%).
Share of selected countires in world oil production and consumption
Source: Dariusz Adryan, licencja: CC BY 3.0.
R1Rqo5DdH4k2Q
Indicate the reasons for the large differences in oil consumption and production between the countries described in the chart above.
Indicate the reasons for the large differences in oil consumption and production between the countries described in the chart above.
Source: licencja: CC 0.
Task 3
Does oil rule the world? Present your answers and elaborate on the topic by answering questions like: How is the situation? How should it be? Why is the situation not as it should be? Draw conclusions.
Does oil rule the world? Present your answers and elaborate on the topic by answering questions like: How is the situation? How should it be? Why is the situation not as it should be? Draw conclusions.
Does oil rule the world? Present your answers and elaborate on the topic by creating a metaplan below.
R125FopM1sUZ9
Wykonaj zadanie zgodnie z poleceniem.
Wykonaj zadanie zgodnie z poleceniem.
The above examples give reasons to believe that oil still rules the world.
R1UZjMQMrQXg0
Exercise 1
Select three countries that have the largest share in the world's oil production. Możliwe odpowiedzi: 1. Japan, 2. Brazil, 3. Saudi Arabia, 4. France, 5. Germany, 6. Russia, 7. USA
Select three countries that have the largest share in the world's oil production. Możliwe odpowiedzi: 1. Japan, 2. Brazil, 3. Saudi Arabia, 4. France, 5. Germany, 6. Russia, 7. USA
Select three countries that have the largest share in the world's oil production.
Japan
Brazil
Saudi Arabia
France
Germany
Russia
USA
R1JskNFPpChx3
Exercise 2
Opowiedz o najważniejszych technologiach wydobycia ropy naftowej. Możesz korzystać z wszystkich dostępnych źródeł.
Opowiedz o najważniejszych technologiach wydobycia ropy naftowej. Możesz korzystać z wszystkich dostępnych źródeł.
R1EZLROZxmy4J
Exercise 3
It is assumed that a barrel of oil contains 159 l. Match daily oil consumption in thousands of barrels with the relevant countries (data for 2014). Use statistical yearbooks and the Internet.
tu wybierz
Country: USA, China, Japan, India, Russia
Oil consumption in thousands of barrels (daily consumption): 19 035, 11 056, 4298, 3846, 3196
It is assumed that a barrel of oil contains 159 l. Match daily oil consumption in thousands of barrels with the relevant countries (data for 2014). Use statistical yearbooks and the Internet.
USA, China, Japan, India, Russia
Country
Oil consumption in thousands of barrels (daily consumption)
USA
China
Japan
India
Russia
R12TRR0wDb3xs
Exercise 4
Find the countries that are not OPEC Member Countries. Możliwe odpowiedzi: 1. China, 2. Libya, 3. Saudi Arabia, 4. RSA, 5. Mexico, 6. Iran, 7. Katar, 8. United Arab Emirates, 9. Kuwait
Find the countries that are not OPEC Member Countries. Możliwe odpowiedzi: 1. China, 2. Libya, 3. Saudi Arabia, 4. RSA, 5. Mexico, 6. Iran, 7. Katar, 8. United Arab Emirates, 9. Kuwait
Find the countries that are not OPEC Member Countries.
Organizacja Krajów Eksportujących Ropę Naftową (Organization of the Petroleum Exporting Countries) z siedzibą w Wiedniu. Celem organizacji jest kontrolowanie światowego wydobycia ropy naftowej, poziomu cen i opłat eksploatacyjnych. Utworzona została w 1960 w Bagdadzie
![Na ilustracji wykres punktowy udziału kontynentów w produkcji i zużyciu energii, Share of continents in energy production and consumption (%). Z lewej strony na osi pionowej Y opisano wartości od zera do czterdziestu pięciu (konsumpcja, consumption). Na osi poziomej X opisano wartości od zera do czterdziestu pięciu (produkcja, production). Punkty umieszczone w różnych miejscach wykresu, rozrzucone. Azja [konsumpcja: około 40 %, produkcja około 40%], Ameryka Północna [konsumpcja: około 18%, produkcja” około 16%], Europa [produkcja: około 7%, konsumpcja około: 8%], Ameryka Łacińska [konsumpcja około: 6%, produkcja: około 7%], Afryka [konsumpcja około: 5%, produkcja około: 9%], Państwa Pacyfiku [konsumpcja około: 1%, produkcja około 3%].](https://static.zpe.gov.pl/portal/f/res-minimized/R1DXwflKTDOIR/2/1MOqjVydRSVbADjHoY7ykGYPzXfgO9C1.jpg)